HDR IMAGING
PART 1: A PROPOSAL FOR REALTIME HDR TONE MAPPING (2008)
I wrote the following article as part of my PhD proposal back in 2008 when I was an MSc student at Bristol University. Although this particular project did not materialise, I continued my interest in HDR imaging:
Even after the introduction of digital cameras, for years, professional photographers have preferred to use film-based SLR cameras for their photography. The main reason for that was a lower pixel count in a digital camera image sensor compared to a film. Nowadays, with newer technologies in semiconductor fabrication, this problem has been overcome by many pixels in a smaller area. Image production workflow from capture to display has been made easy, quick and robust by electronic circuits. New imaging technology created new areas in photography. One of these areas is HDR (High Dynamic Range) photography.
A High Dynamic Range image is an image which has very high contrast, including both very low and very high luminance (brightness) components. For example, an image that is taken from the interior of a church has a contrast ratio of approximately 5,000:1. In comparison, the dynamic range of a standard jpeg image is 256:1. While reviewing the church image, it can easily be realised that windows are over-exposed, and beneath stands, tables and chairs are under-exposed. An average human eye can probably adapt itself to a high dynamic range and see enough detail in these two regions. But an image sensor does not have enough dynamic range to capture all the details in the scene: The highlighted areas are saturated into white, and shadowed areas are darkened into black. To avoid this problem, two approaches have been proposed. In one approach, different exposures are taken from a scene (also known as exposure bracketing) and are combined to produce an HDR image. Considering the church example, if a short exposure is taken for capturing details in highlighted regions, and a long-exposure is taken for the shadowed areas in addition to the regular exposure, then almost all details of the scene are captured. The next step is combining these three or more photos with different levels of exposure into a single HDR image. However, in practice, taking multiple photos is not convenient, and most HDR images suffer from ghosting effects due to camera shake or object movement between multiple exposures.
The second approach is taking HDR photos within a single shot by increasing the image sensor's dynamic range. One method, which is commercially released by Fujifilm (Fujifilm EXR), is to increase the dynamic range of a pixel by using two photodiodes with different sensitivity within a single pixel. Another method uses a logarithmic pixel, which has a logarithmic response to the light instead of a linear response. Therefore, highlighted areas will not be saturated into white.
As mentioned above, while the contrast ratio of an LCD display is not more than 500:1, it is not possible to display an HDR image by a conventional display. The same problem will occur: highlights are saturated into white, and shadows are displayed as black. Probably, HDR display is a solution to this problem. Currently, BrightSide, acquired by Dolby, is producing 37-inch HDR displays claiming a contrast ratio around 200,000:1 and 16-bit per colour. This display uses colour LEDs, but the main problem is that the LEDs occupy a large area and cannot get close enough to each other, hence, larger size display.
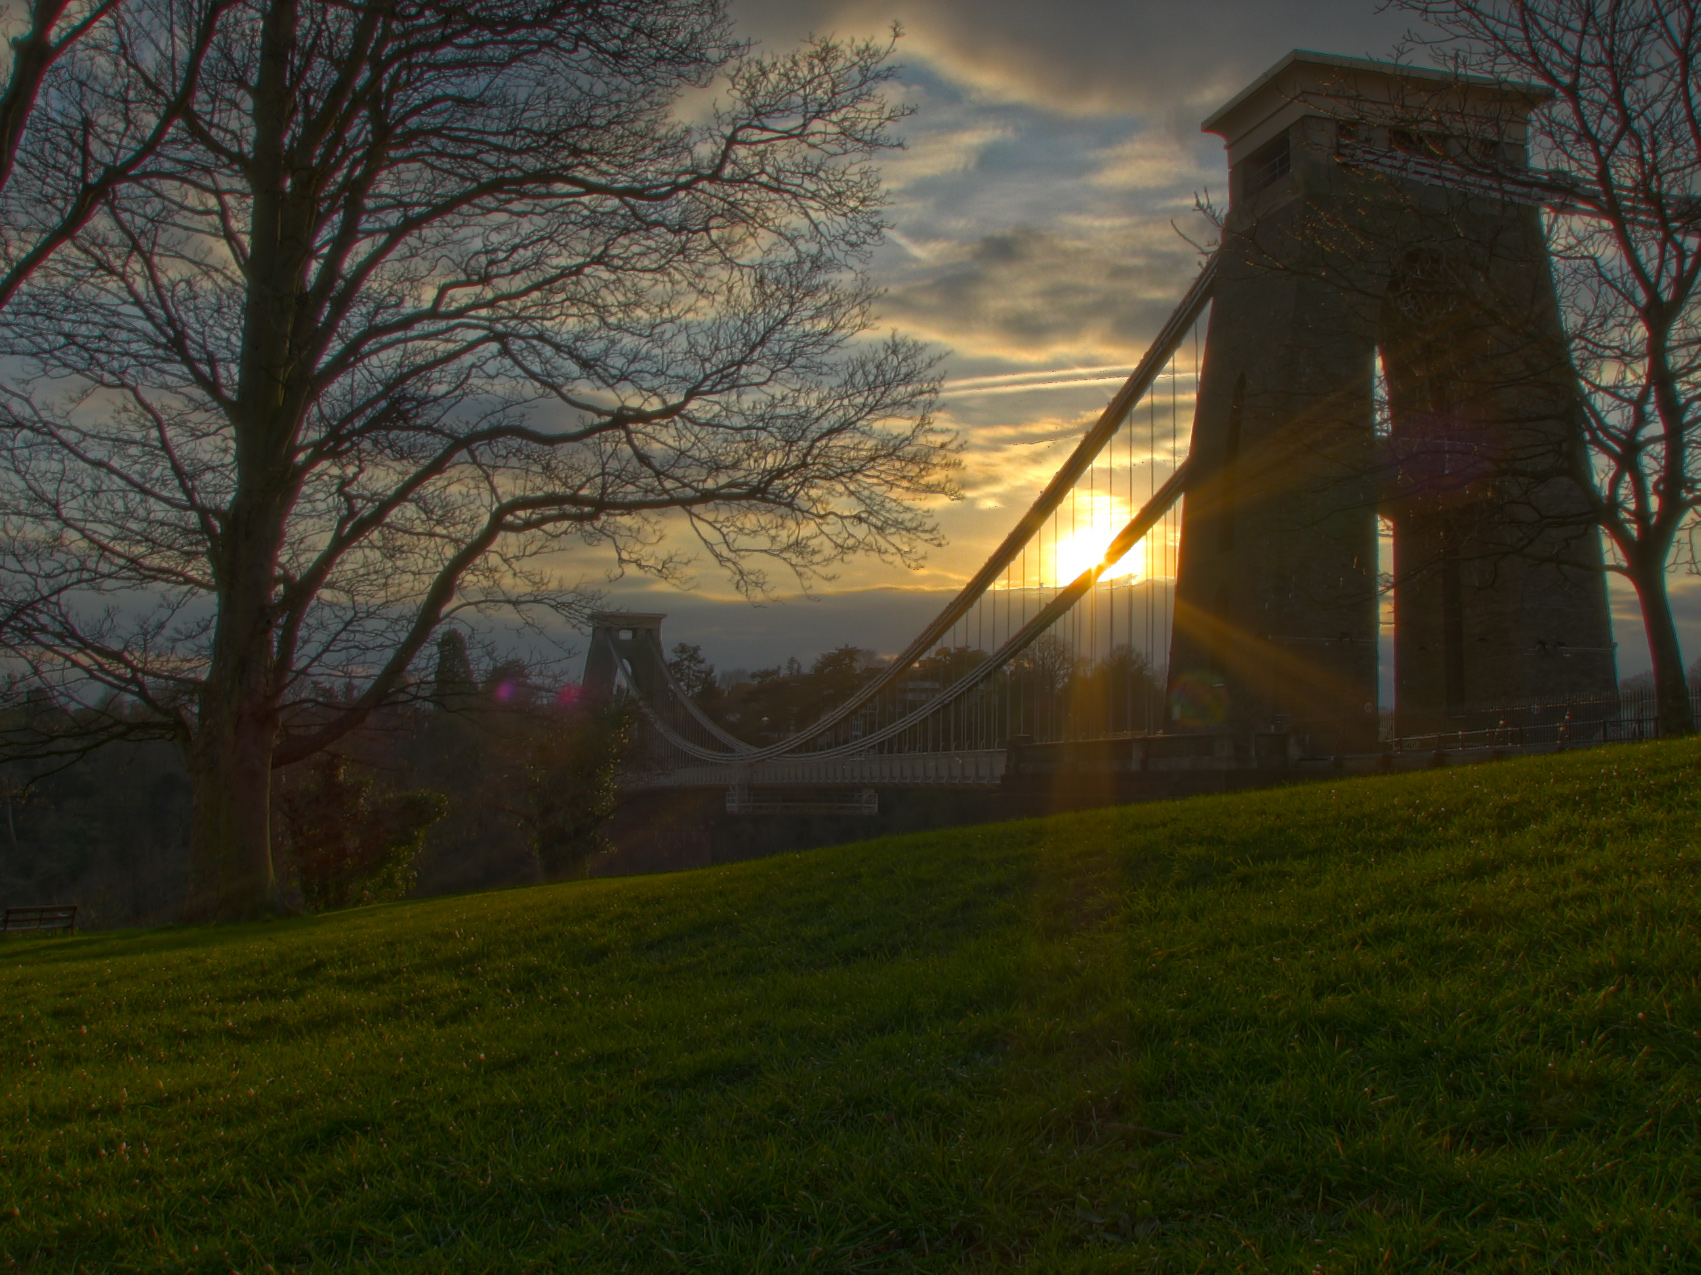
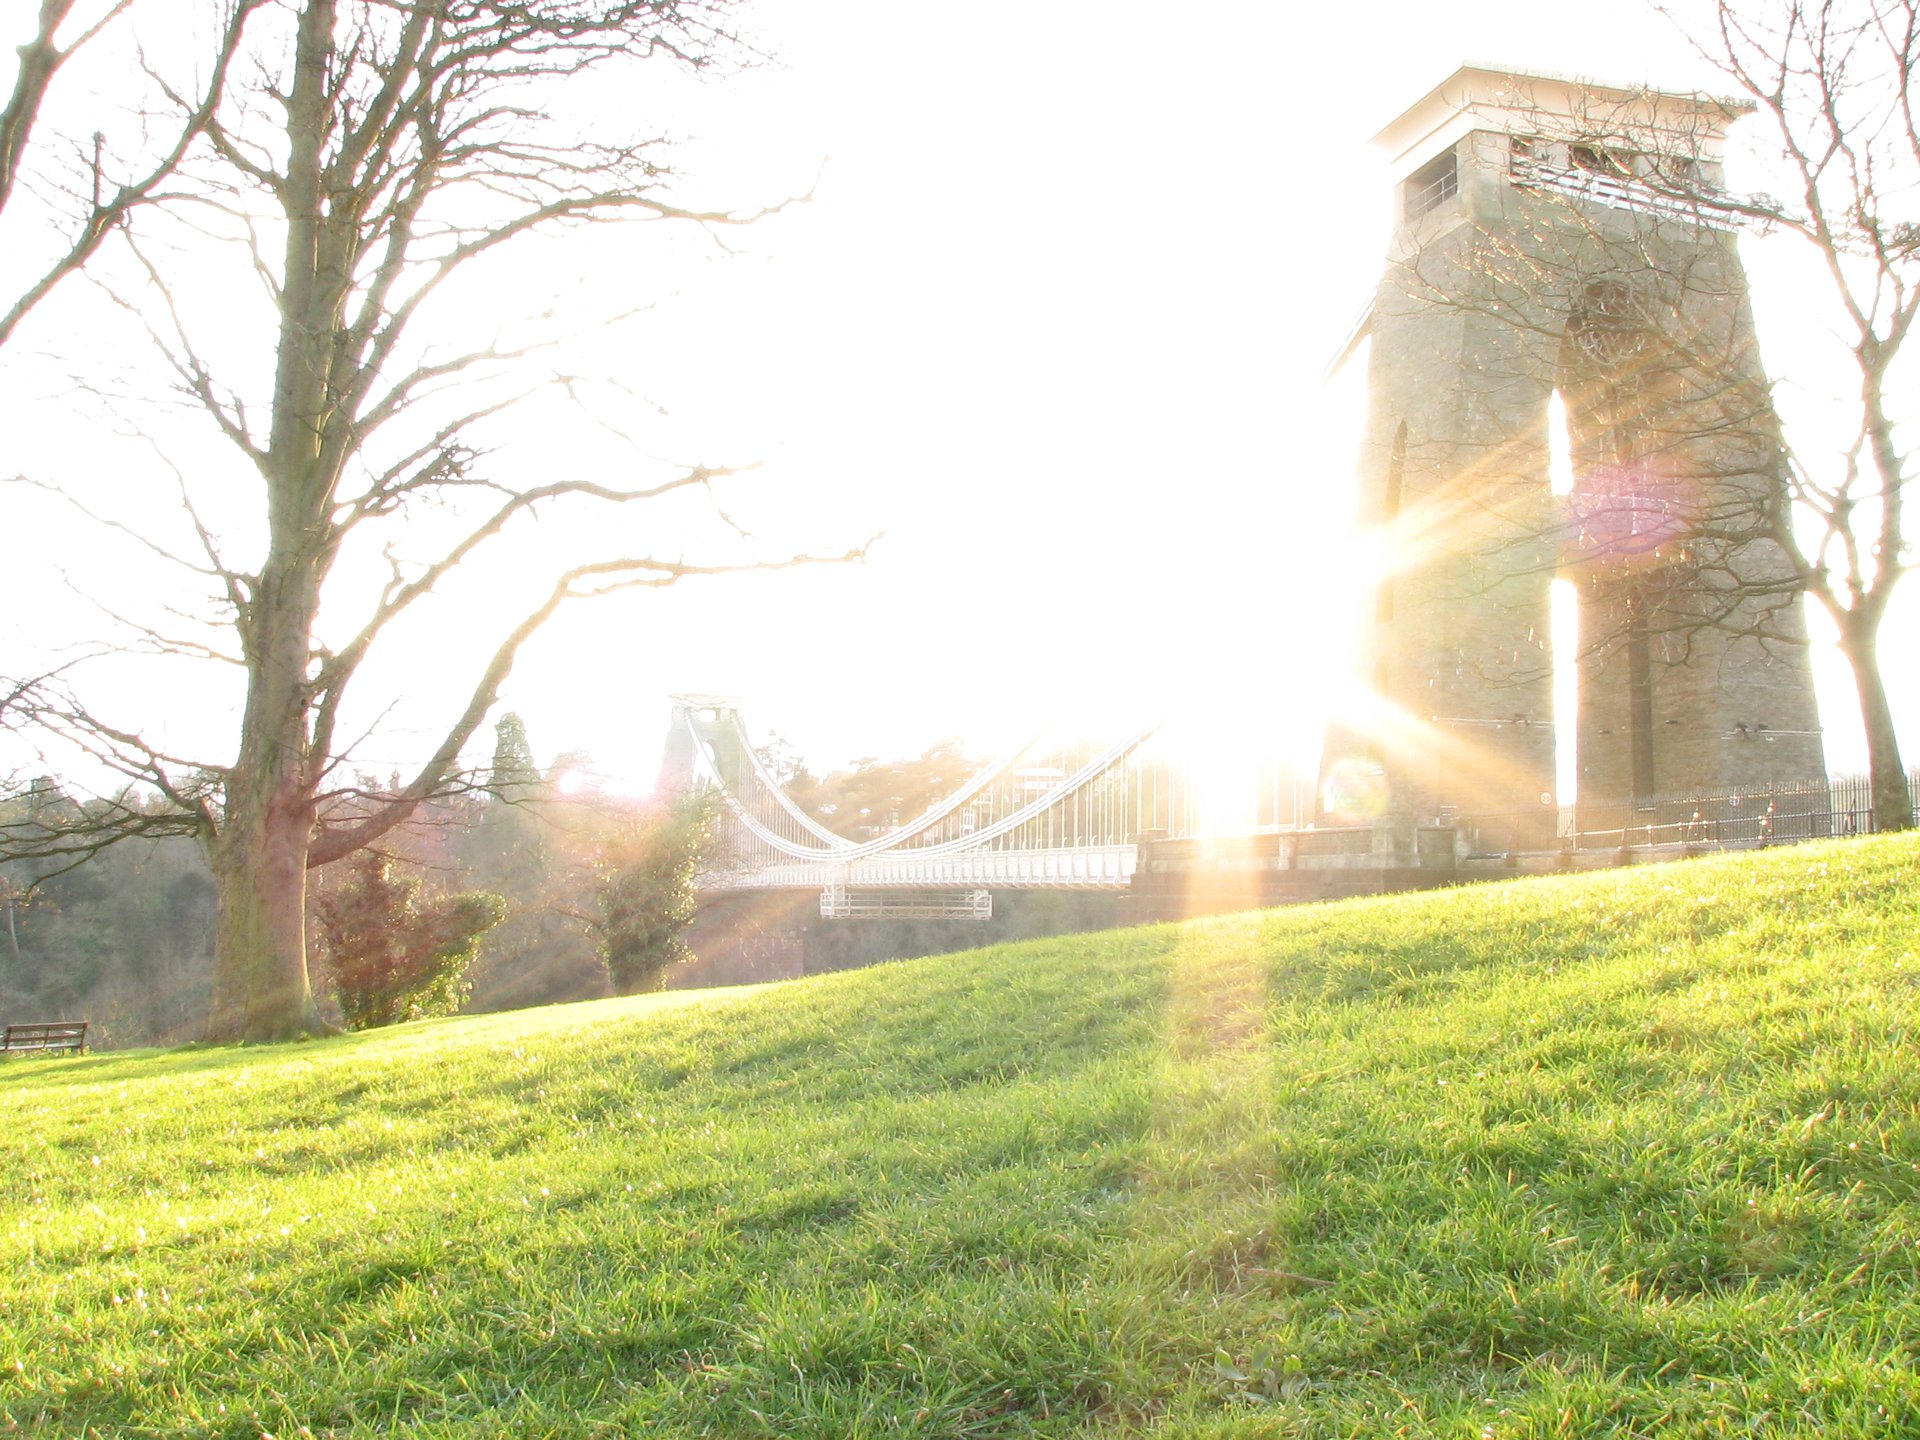
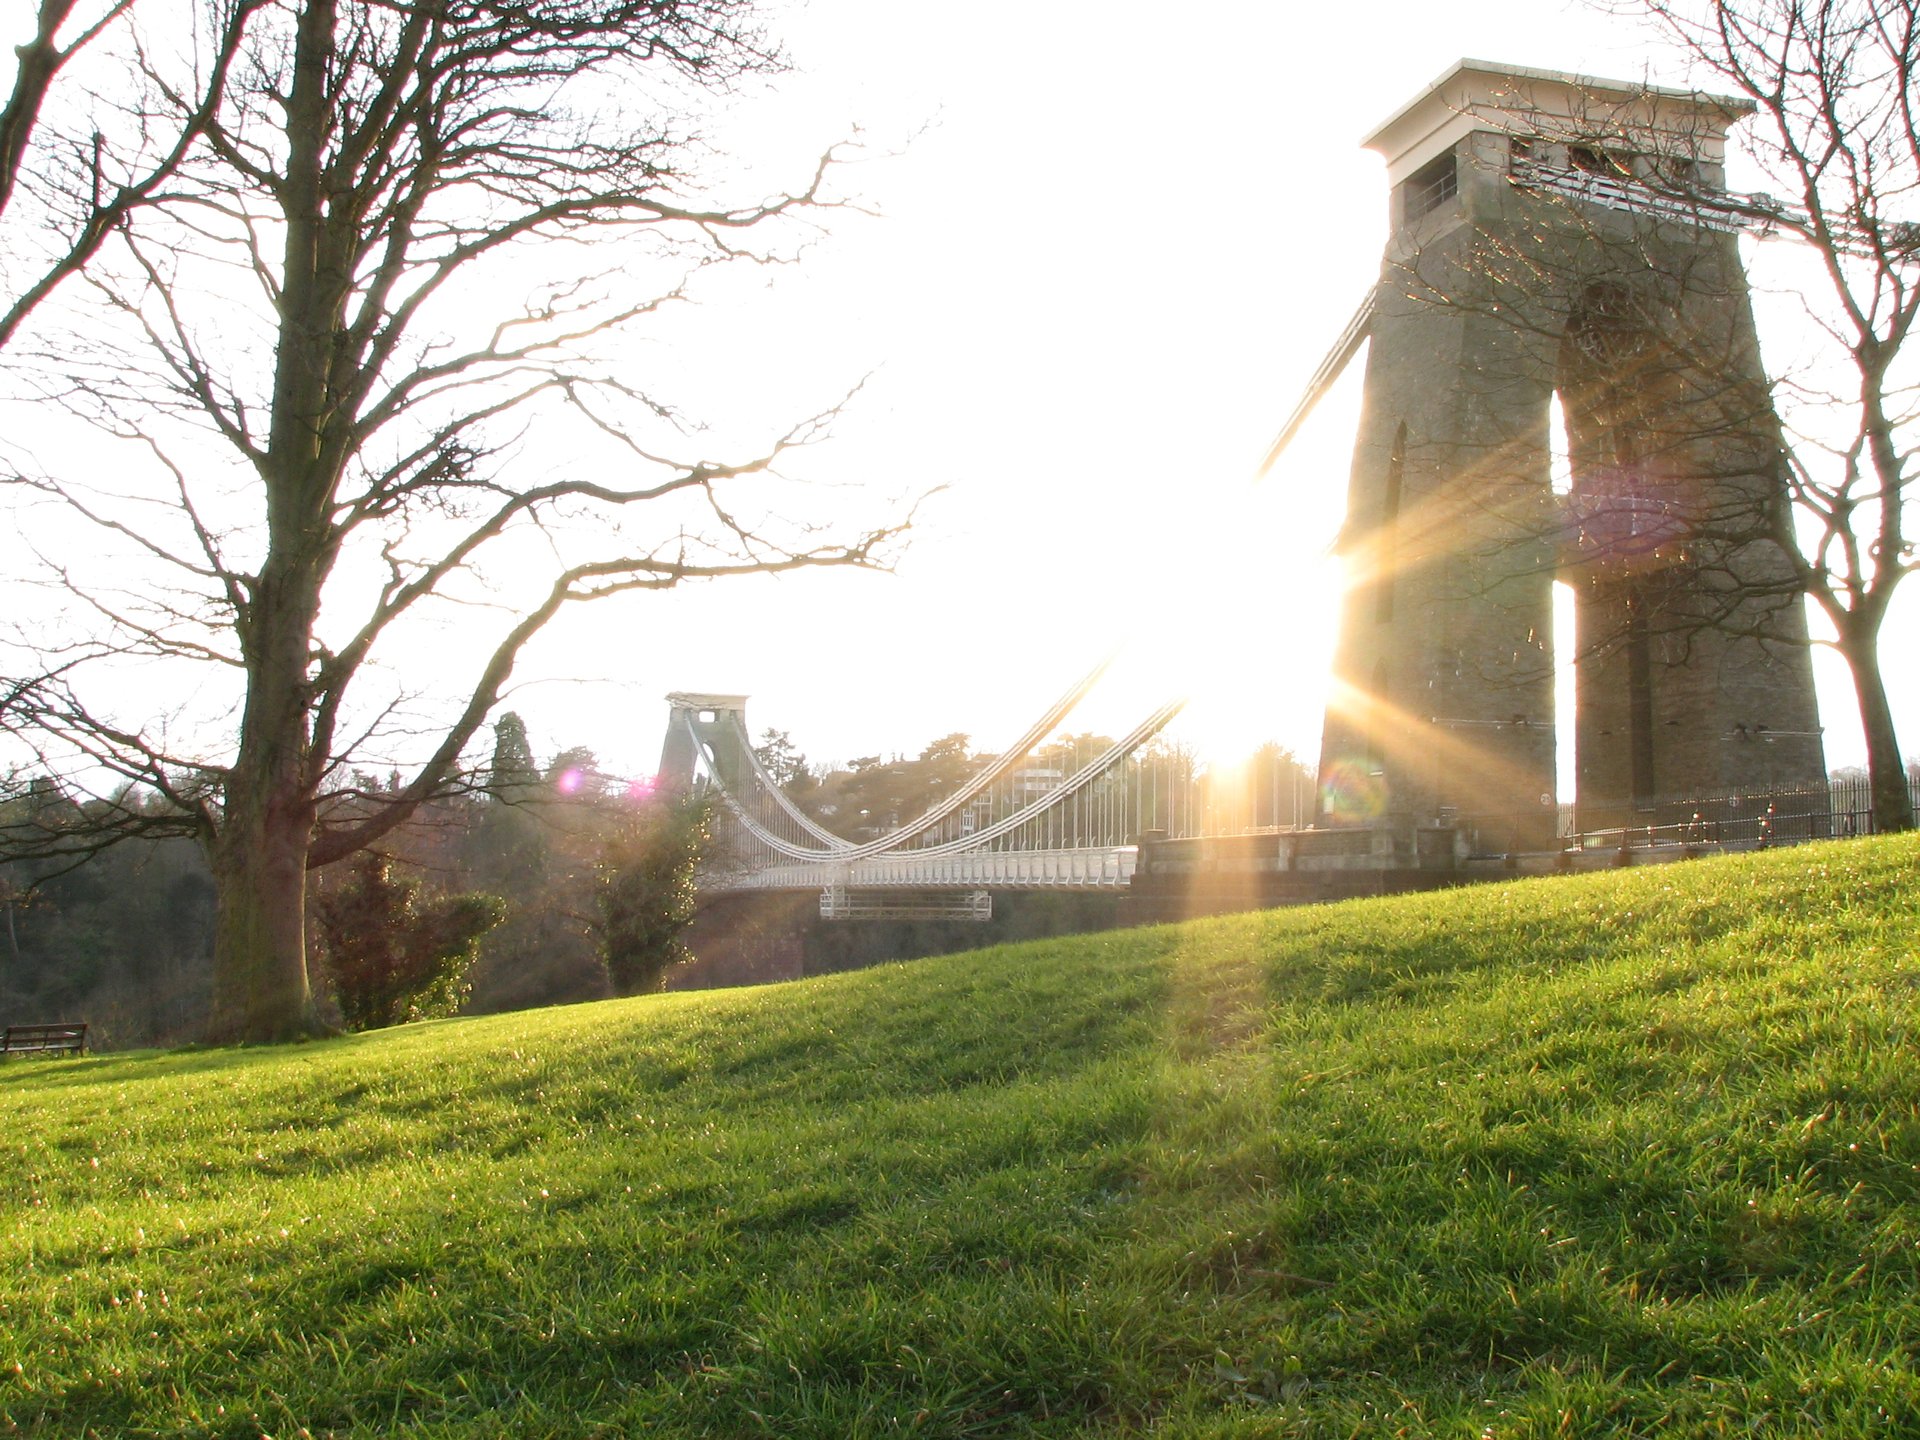
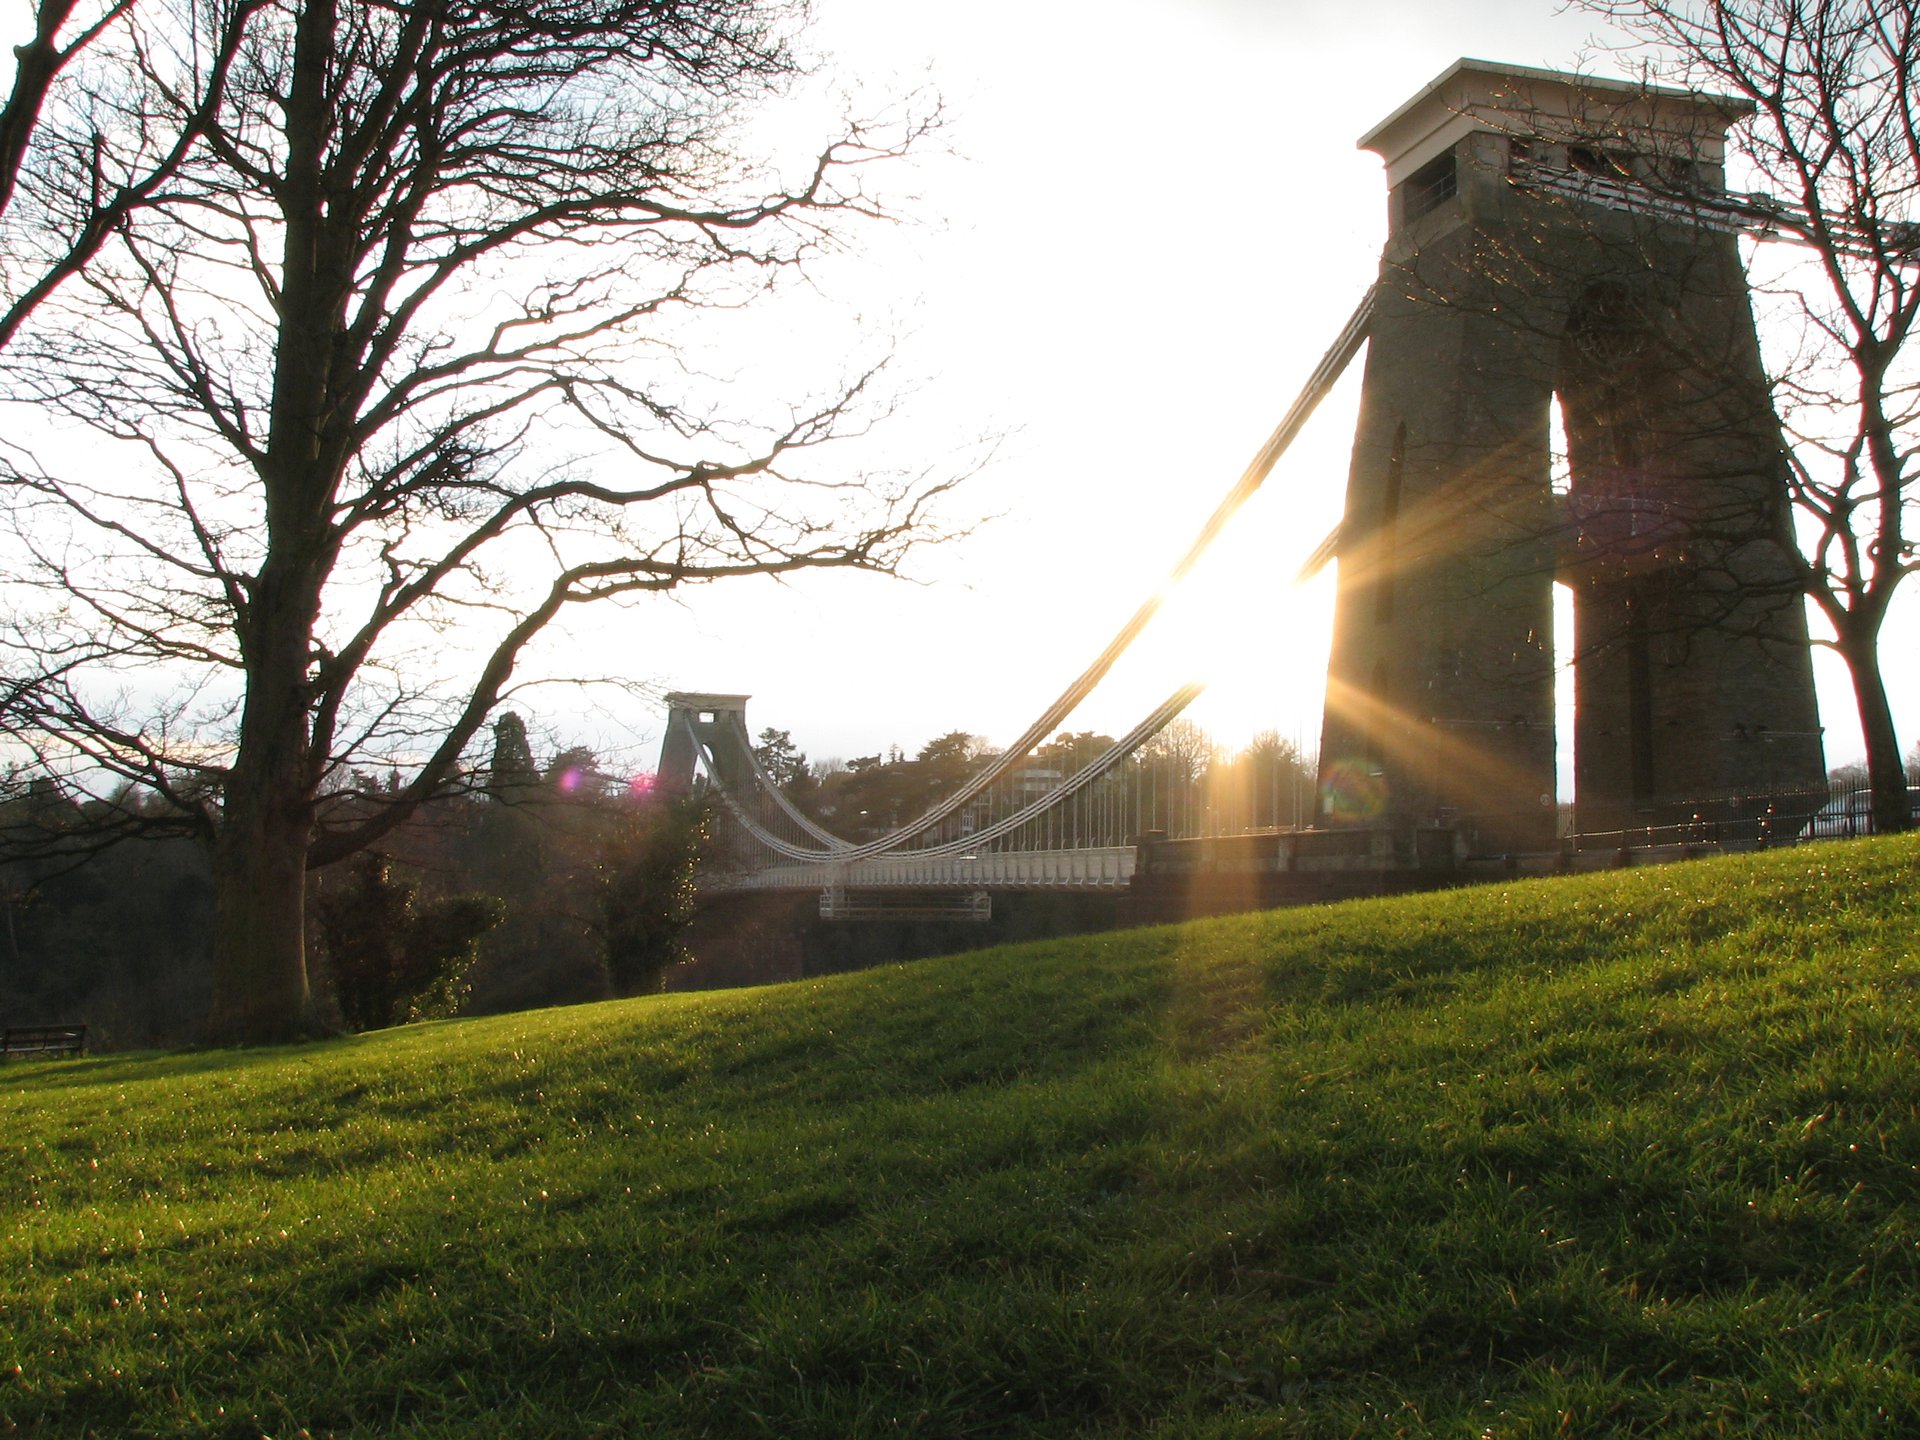
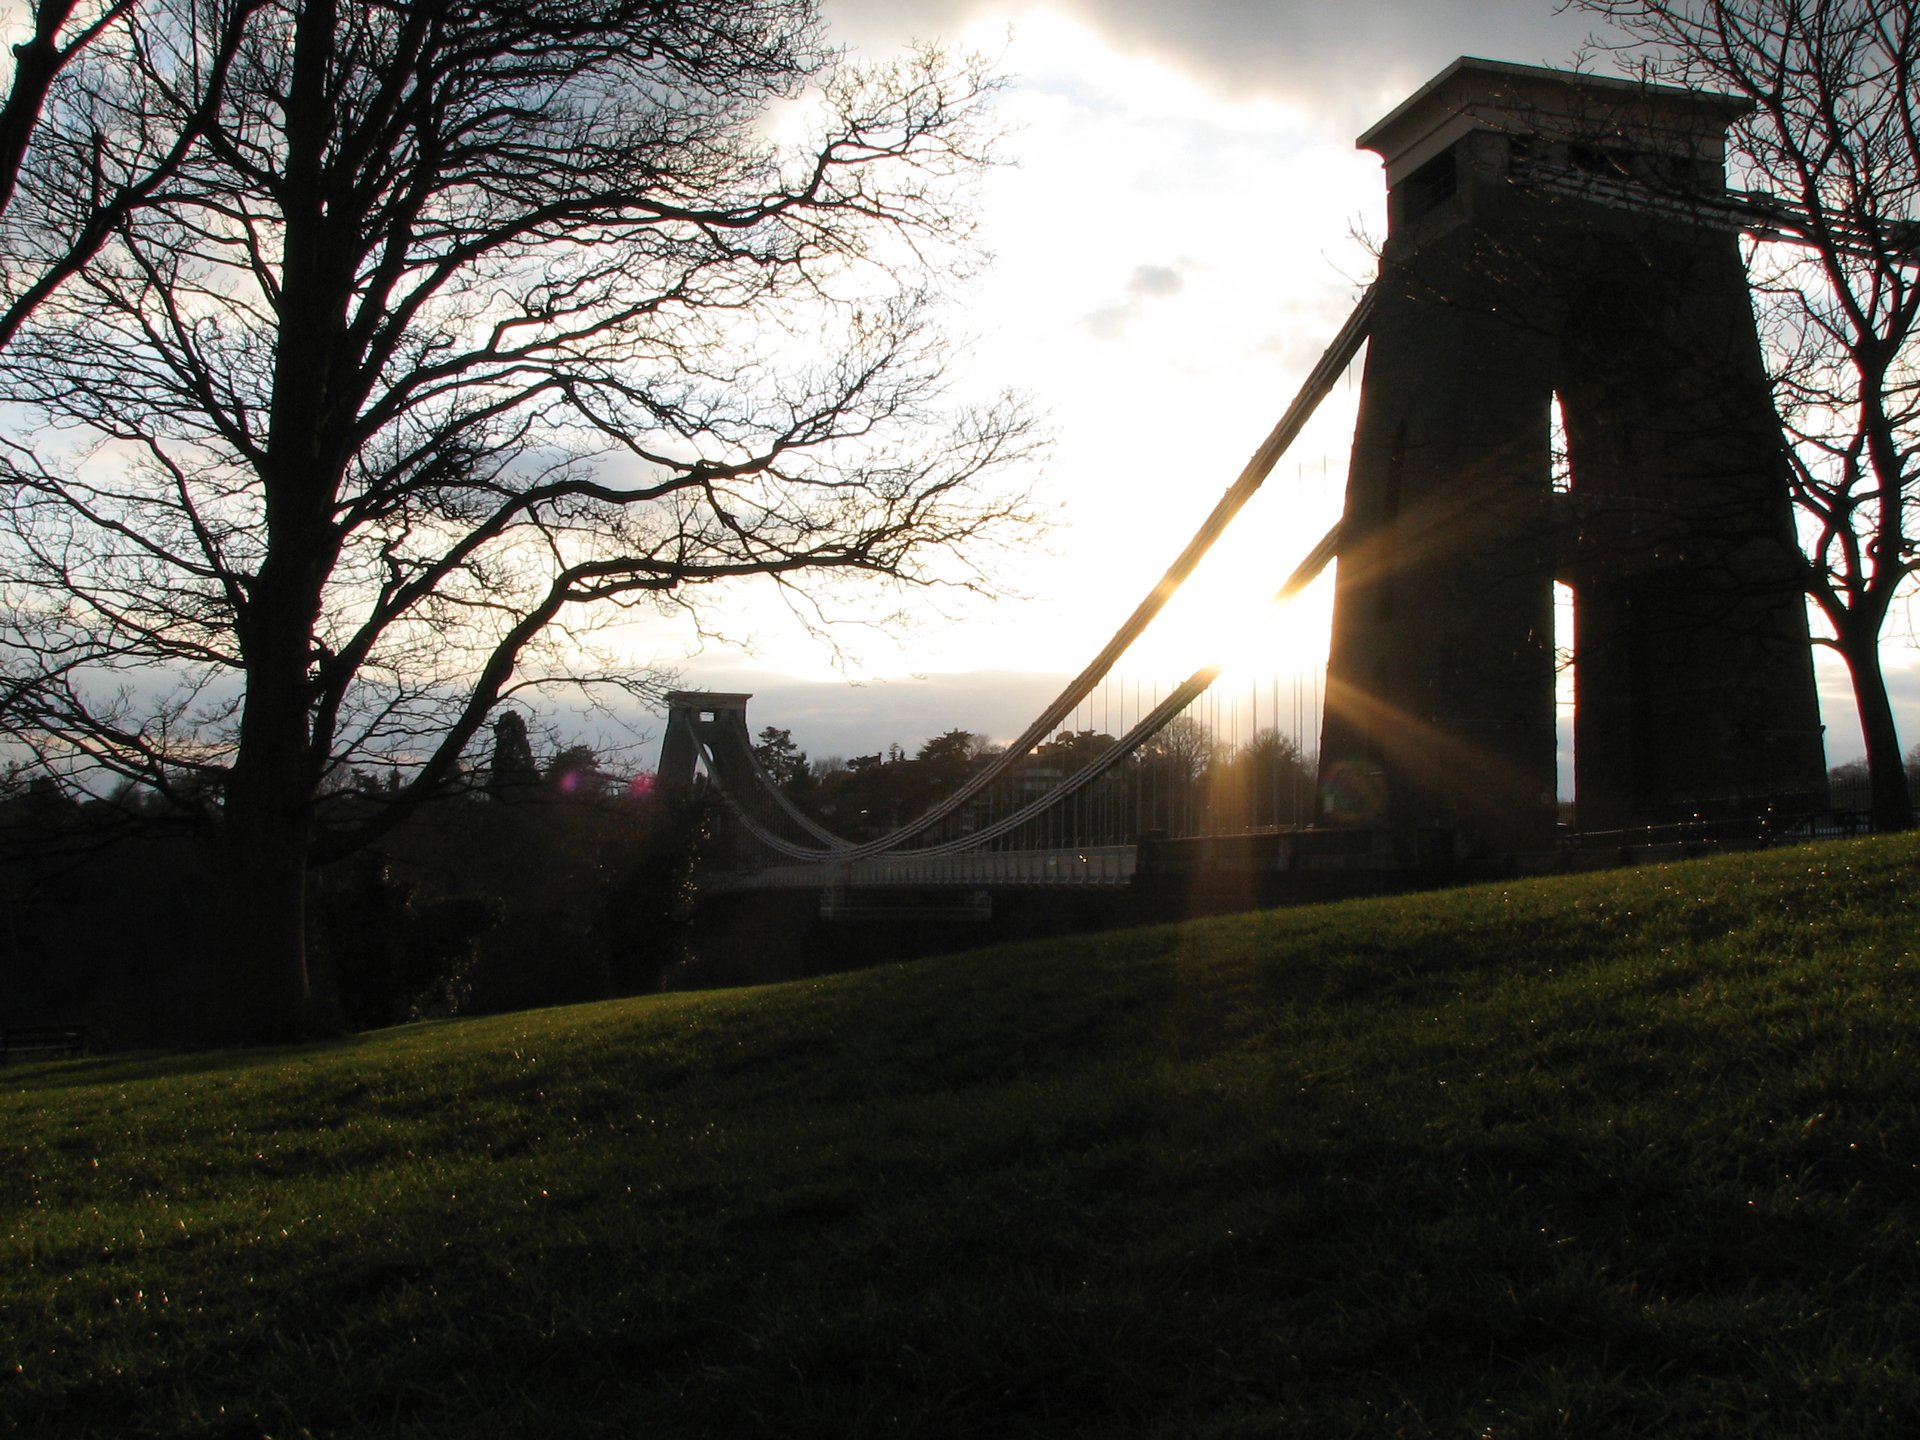
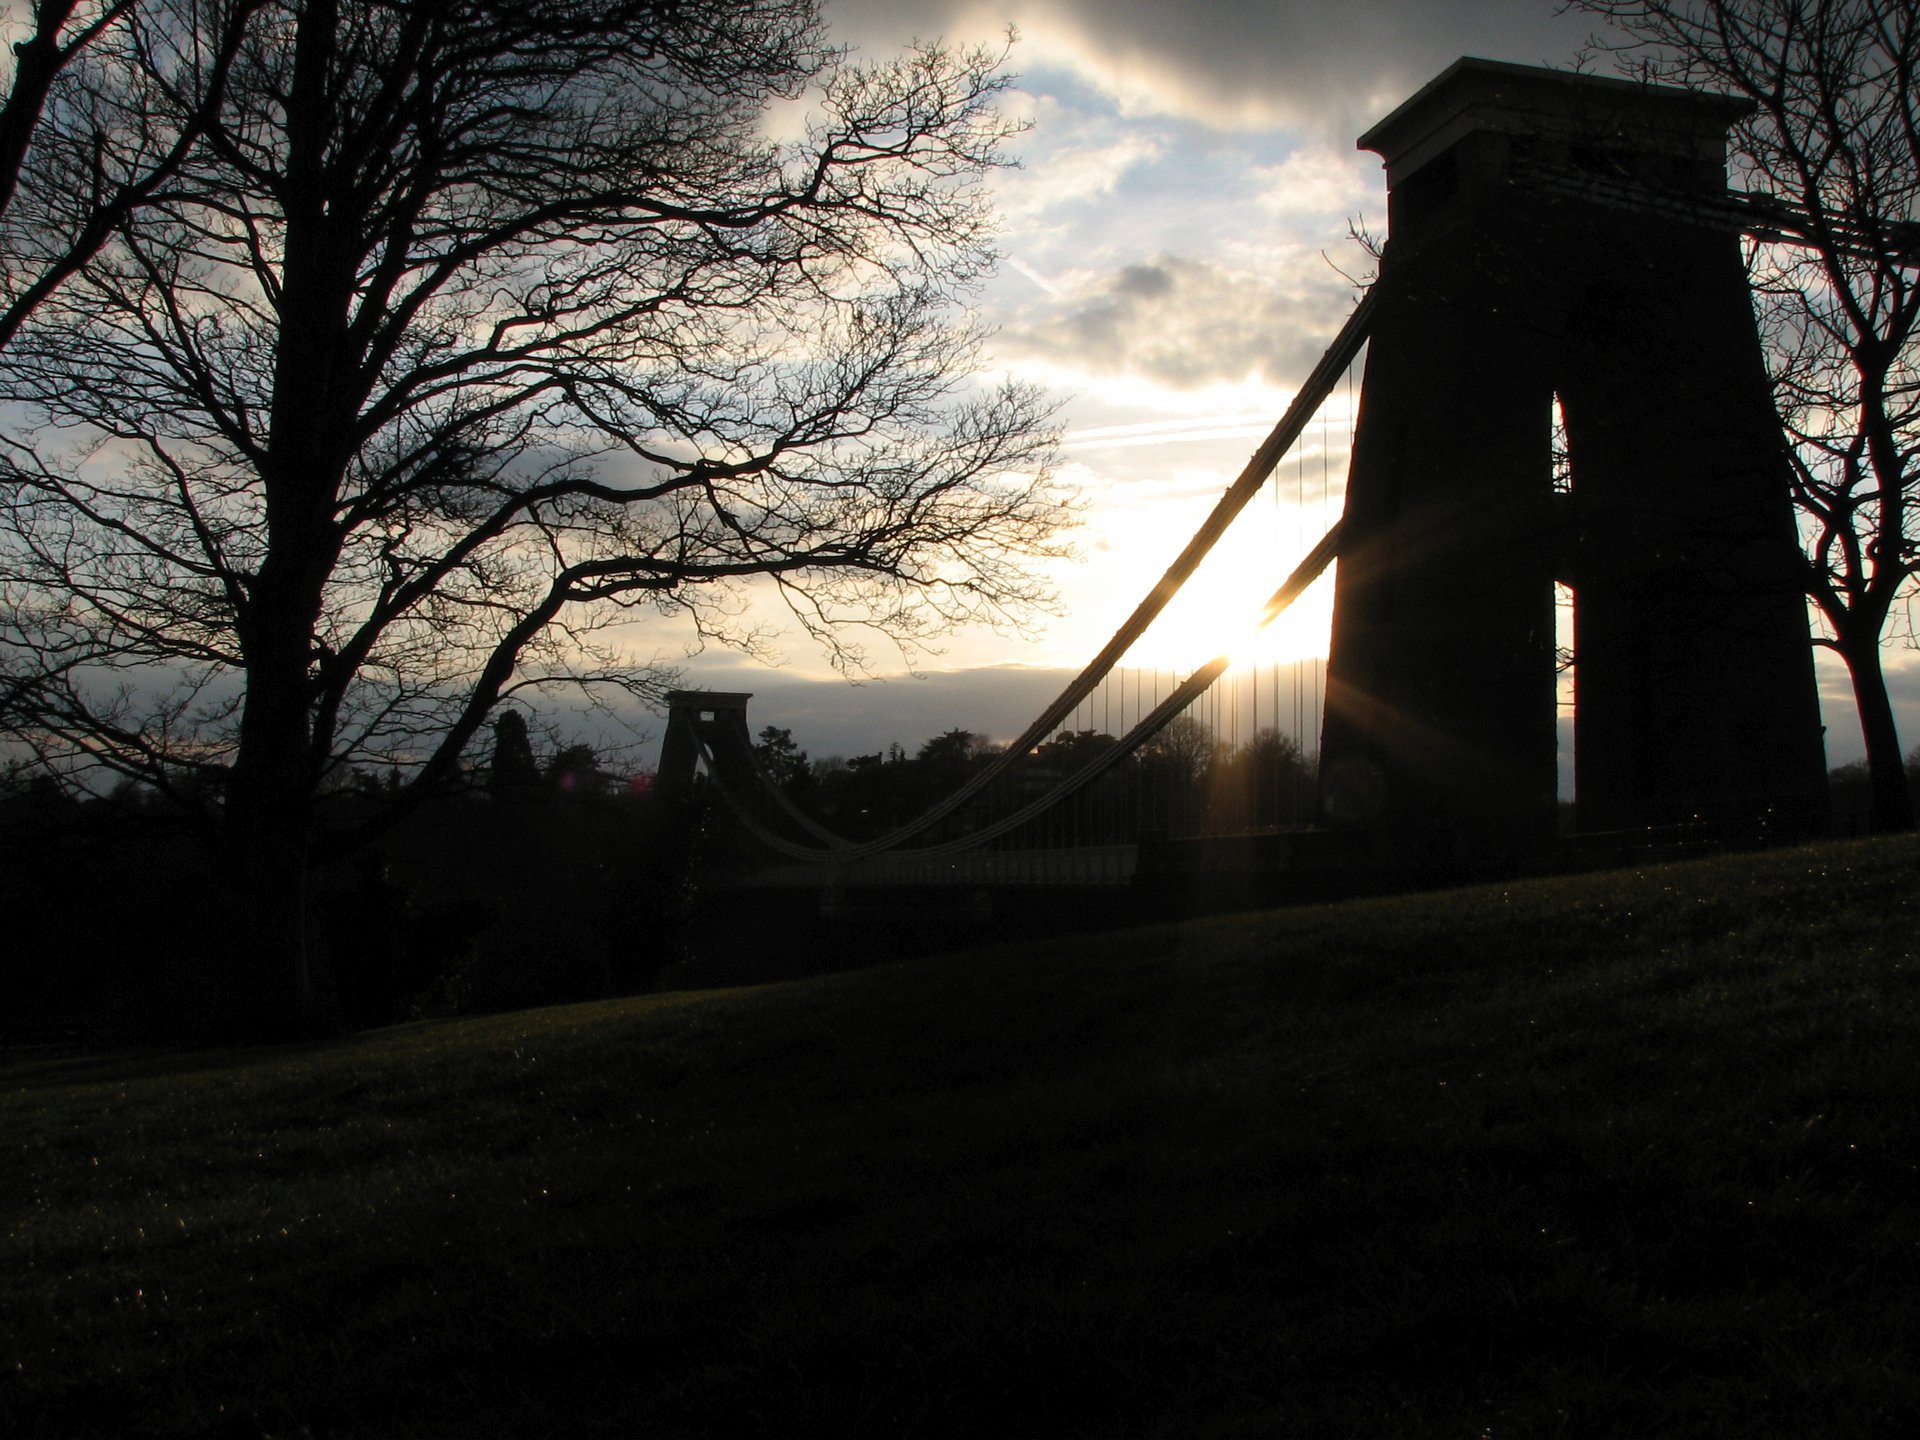
Tone-Mapping is a method that displays an HDR photo by a conventional LDR (Low Dynamic Range) display. Usually, this method aims to darken highlighted regions and highlight shadowed regions while preserving all details in the scene as much as possible. Several algorithms have been proposed which they have some common or different features. These algorithms can fall into two types: global or local operators. In global operators, a global variable of the image is considered. The simplest algorithm using global operator is tone compression by L=Y/(Y+1) which Y is in the [0, ∞) domain, and L is in the [0, 1) domain. Although this method is quick and easy, it is not practical due to the possibility of losing details. The local operator is much more sophisticated by dividing the photo into several regions and manipulating them individually. In both global and local operators, luminance or contrast can be an image variable. Some methods, such as contrast equalisation, proposed by Mantiuk, seems to be more efficient than other methods while considering contrast instead of luminance as an image variable. A hybrid approach using both global and local variables is also proposed. In addition, human visual perception is also considered to obtain a better final result. Several tone-mapping algorithms have been introduced in very recent years, including Mantiuk using Gradient of Image [1], Fattal [2], Drago [3], Durand [4], and Reinhard [5,6]. Figure 1 shows a series of multiple exposures from Suspension Bridge in Bristol, UK. As the camera looks into the sun, a large dynamic range between the highlights and shadows is created. Figure 2 shows the animated sequence of exposures. As seen in the sequence, the clouds in the background move between the frames, creating a ghost effect after combining all the exposures into a single composite hdr image. Figure 3 shows various tone mapping algorithms [1-6] applied to the composite hdr image of the bridge. The hdr image and tone mapping is performed using qtpfsgui (now Luminance HDR).
1/5
1/13
1/30
1/100
123

123

123

123
Fig 1. A series of exposures of Bristol suspension bridge with shutter speeds from slow 1/5 to fast 1/3200 of seconds.

Danial Chitnis, March 2008
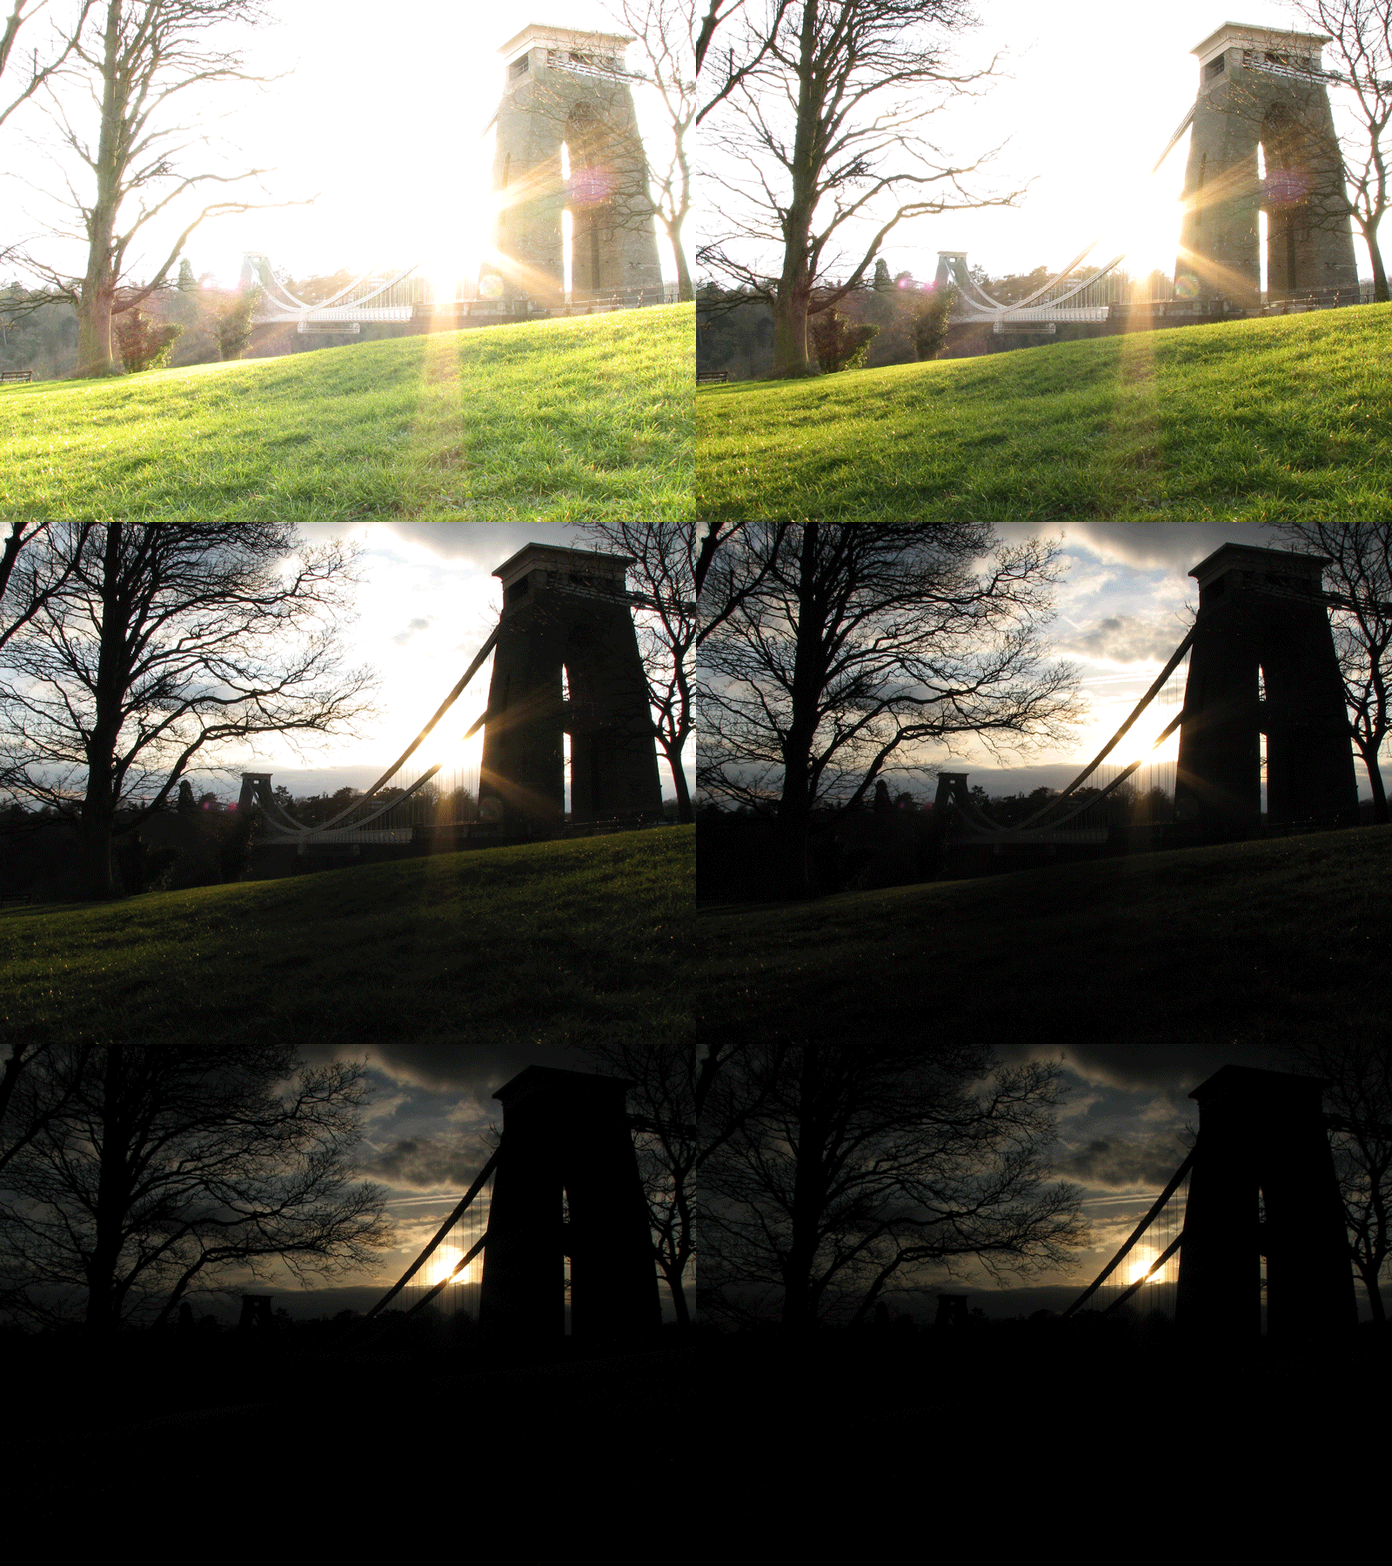
Fig 2. Multiple exposures animated sequence.

Danial Chitnis, March 2008

123

123

123

123

123

123
Fig 3. Tone mapping using various alogorithm.

Danial Chitnis, March 2008
On the implementation side, most of the proposed algorithms are demonstrated by software coding. Implementation on an Nvidia GPU (OpenGL coding) has been reported. The speed of the tone-mapping algorithm is of great importance in real-time applications such as video production, security, and machine vision. Recently, a 2M pixel smart camera in one package has been introduced by OmniVision, a mobile imaging company that claims a dynamic range of 110db, including an internal digital processor embedded into a mobile device.
A tone-mapping method regarding HDR cameras can be studied both in algorithm and implementation. On the algorithm side, the aim is to compare various algorithms to another and propose the best, if there is any. On the implementation side, the running speed of the algorithm will be considered. Also, usually, an algorithm is preferred which has fewer parameters to control. Adding more parameters will increase the complexity of control over the operation. Hardware implementation is another aspect to be studied. Probably reading an HDR value by a high-res A/D convertor is a very slow process. The signal can be maintained in an analogue domain instead of using a digital domain and a DSP so that the computation would be done by an analogue signal processing unit. This approach has the advantage of reducing digital computation complexity, resulting in both lower power consumption and cost. In addition, the difference between algorithms optimised for human vision and machine vision is valuable to be investigated. HDR will be a challenging topic in imaging in the future, both for the academic and commercial markets.
PART 2: AN UPDATE USING MATLAB (2018)
Since I wrote the above proposal in 2008, imaging technology has significantly progressed, and now smartphone cameras are able to record tone-mapped HDR videos. However, the issue of tone-mapping from a higher bit depth (e.g. 14 bits camera) to a lower bit depth (e.g. 10-bit HDR display) remains a challenge, especially in real-time. The tutorial below uses generic tools such as Matlab to process the images which I took in 2008. This start with importing the composite HDR image into Matlab. This composite HDR image can be created within Matlab or other imaging tools which support this file format. Note that to evaluate the quality of the images, it is best to have a high-quality calibrated display. For the best results, the brightness of the screen should be set to maximum. This is to ensure that the maximum dynamic range of the display is being used. However, note that the internal processor of the display may further modify the image. First, load the hdr file:
hdr = hdrread('IMG_5732_Bristol_bridge_HDR.hdr');Display the image after applying gamma correction:
imshow(lin2rgb(hdr));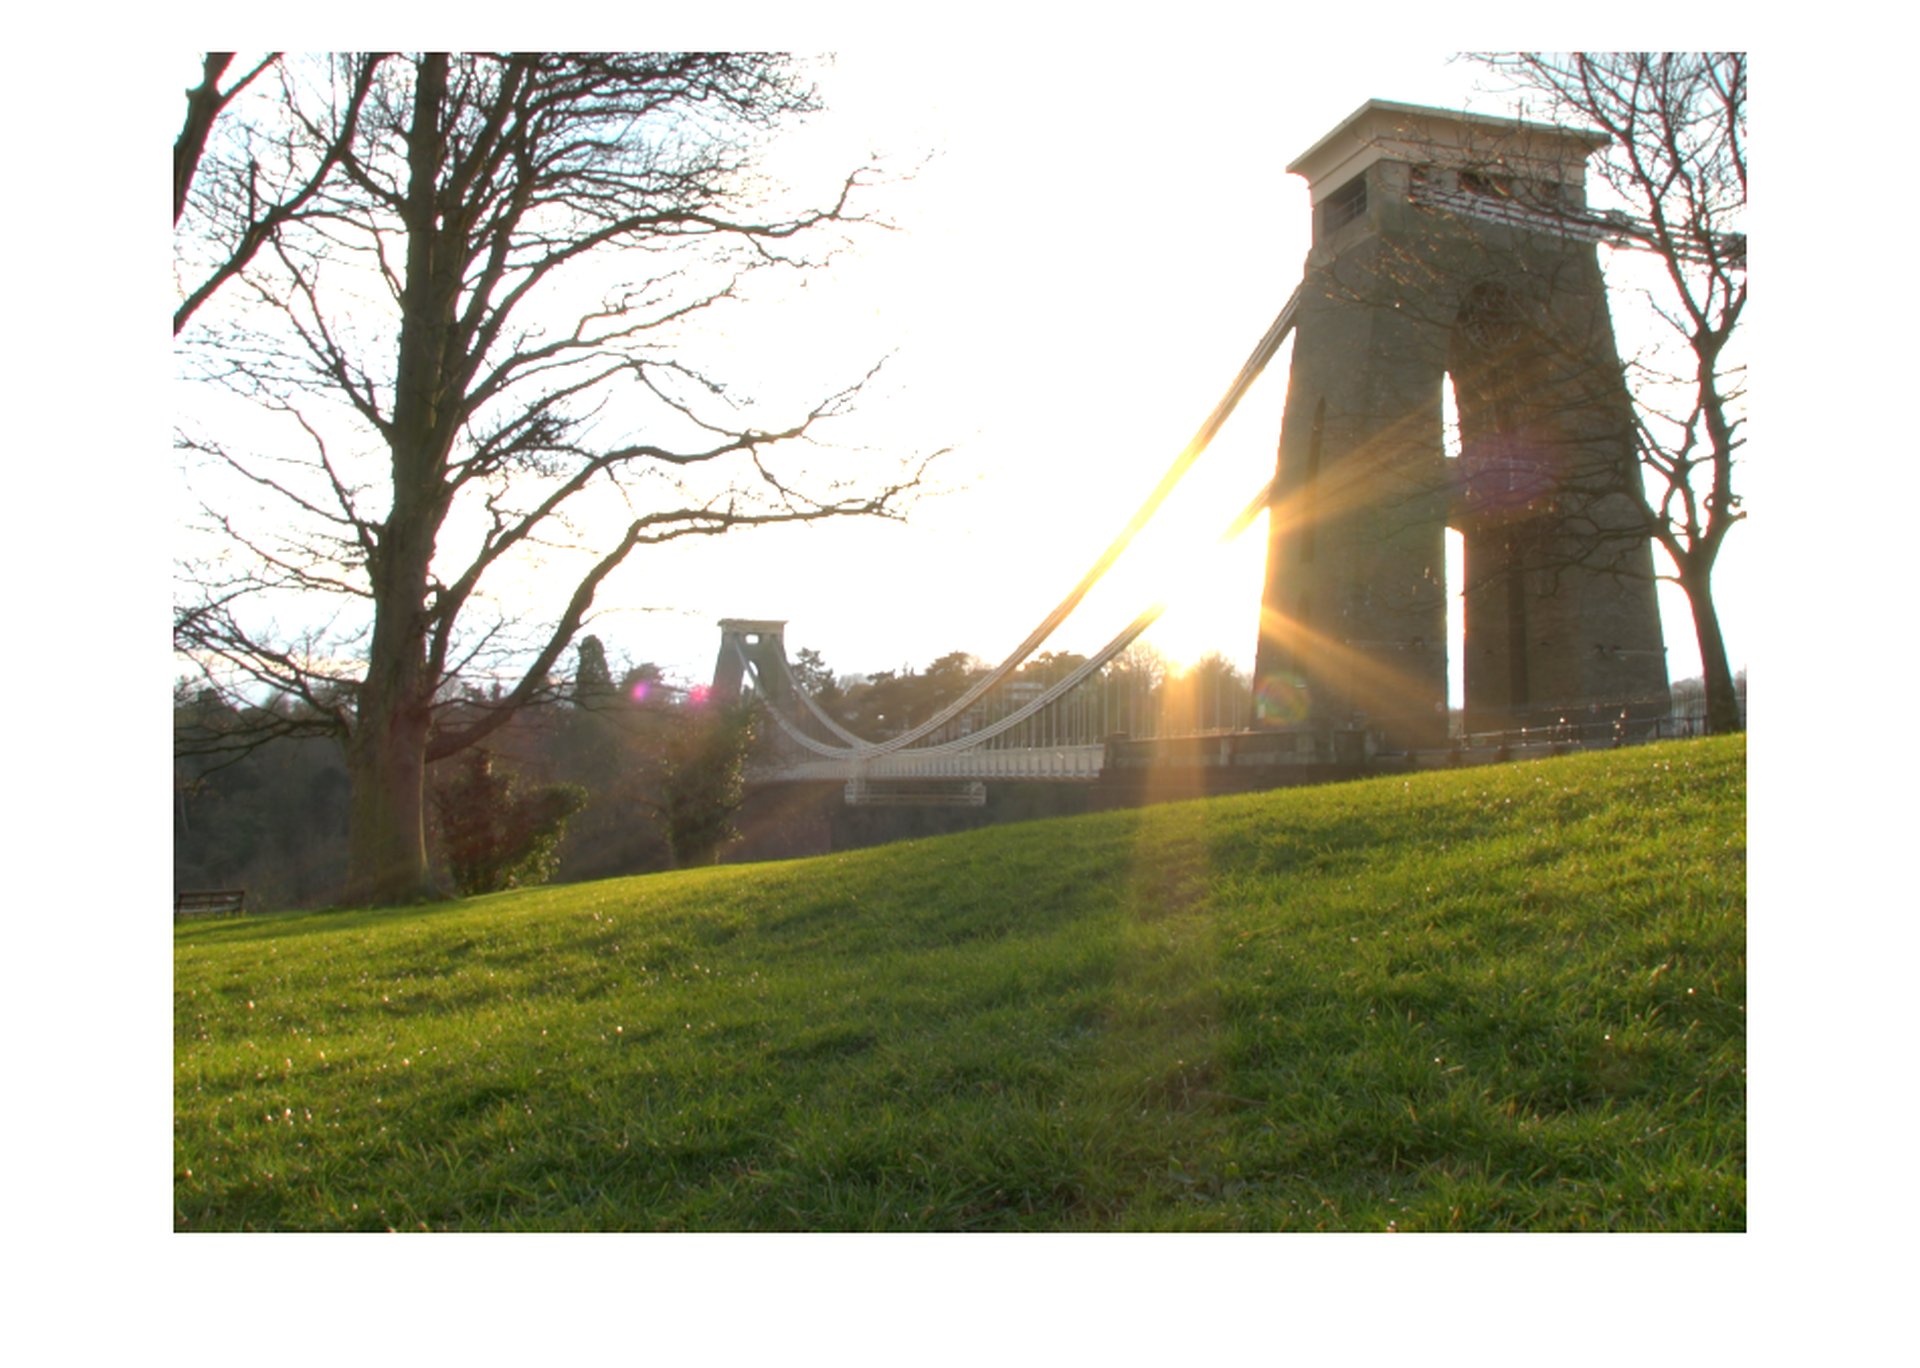
the contrast of the shown image is too high, and the sky and the sun are completely saturated. To begin the HDR tone mapping process, we have to first analyse the image by separating the red, green, and blue channels:
hdr_r=hdr(:,:,1);
hdr_g=hdr(:,:,2);
hdr_b=hdr(:,:,3);

hdrL_r=log10(hdr_r);
hdrL_g=log10(hdr_g);
hdrL_b=log10(hdr_b);
Then we display each channel in logarithm (base 10) with false colours:
imagesc(hdrL_r); colorbar; colormap jet;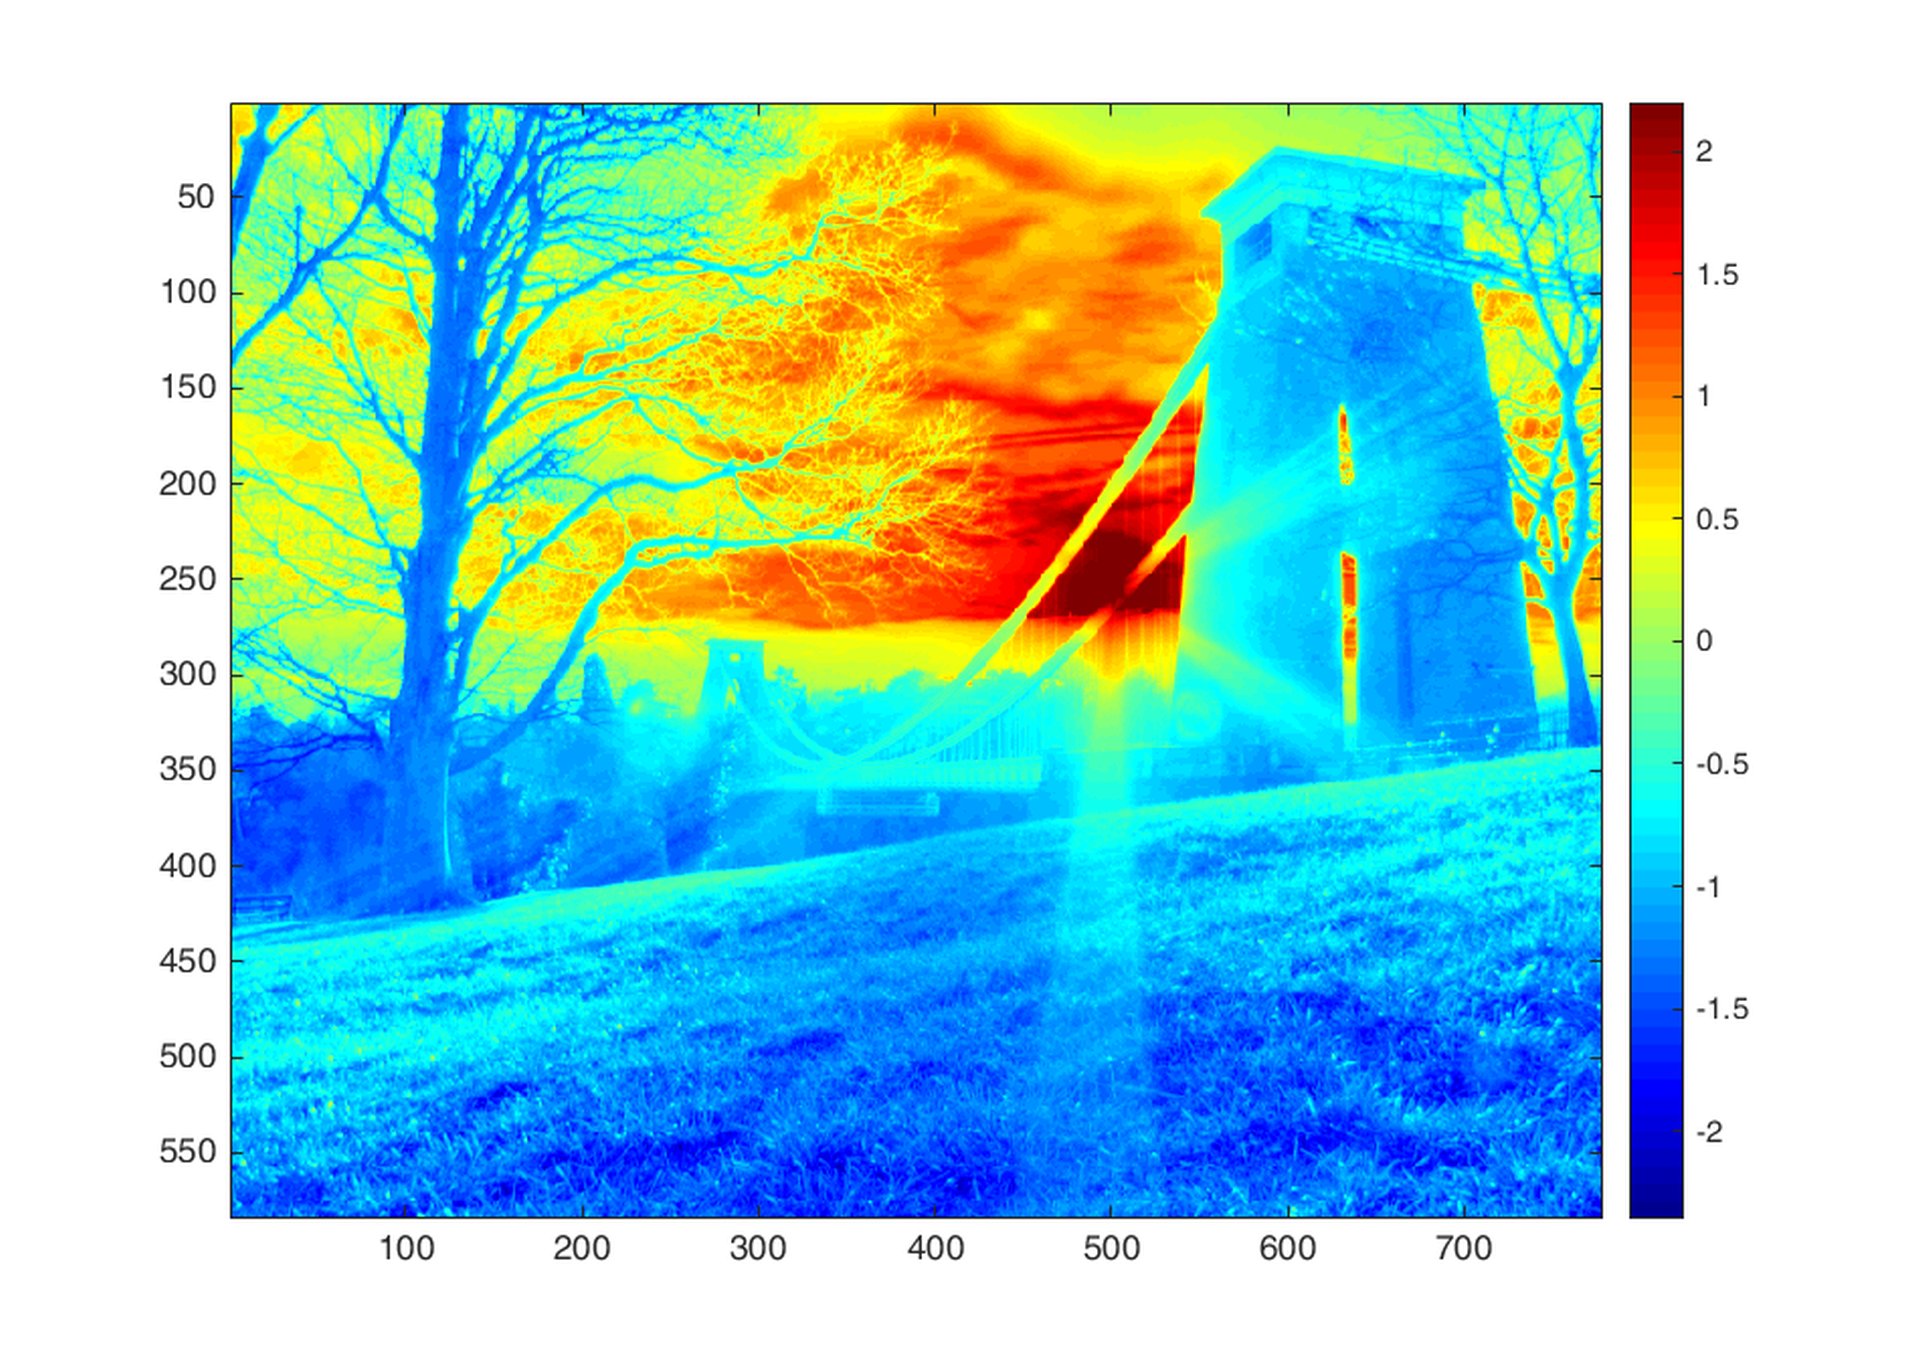
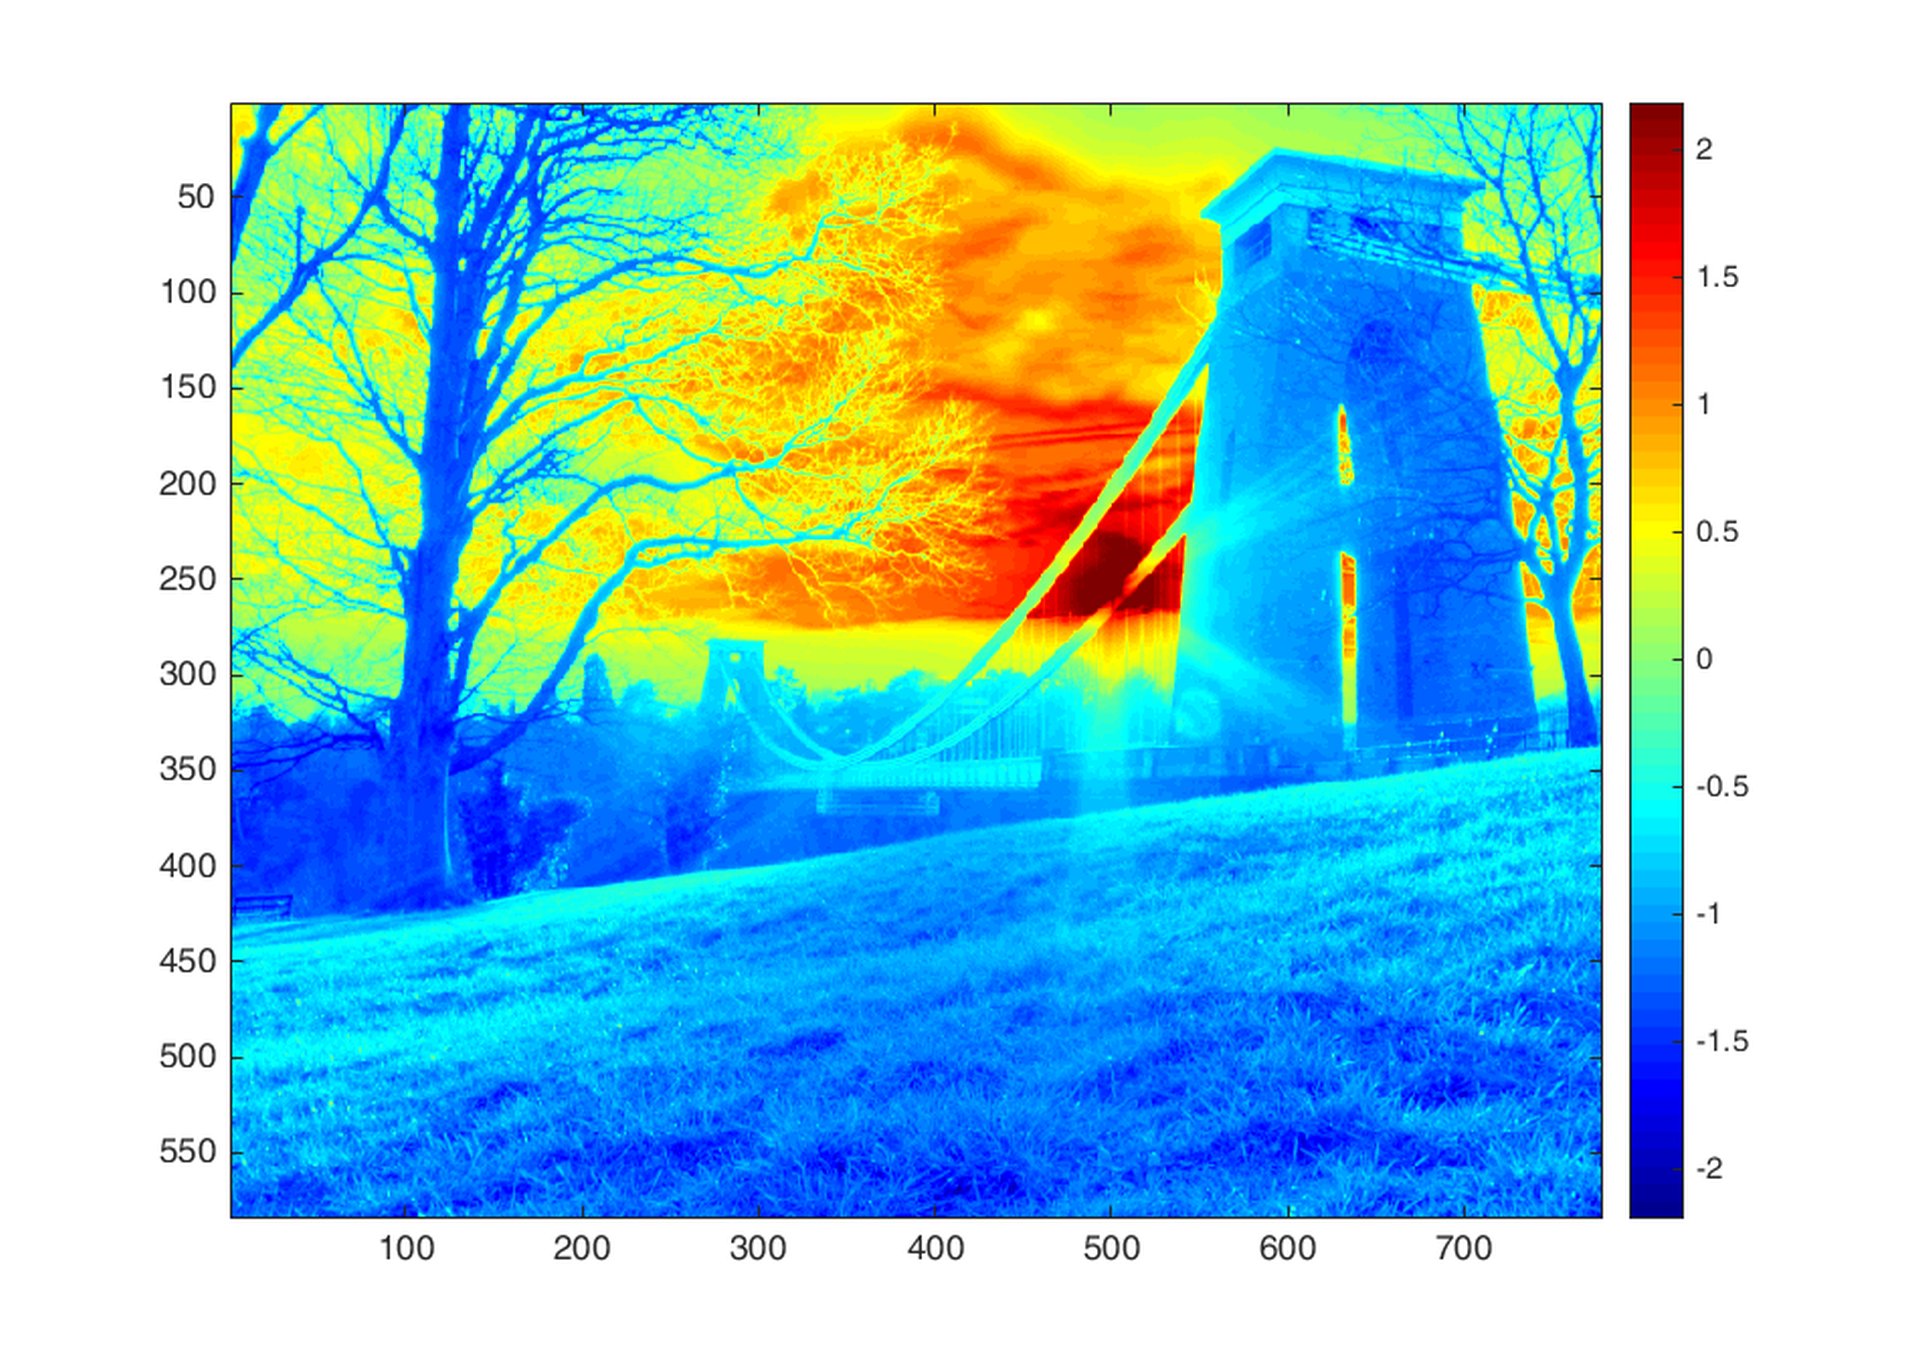
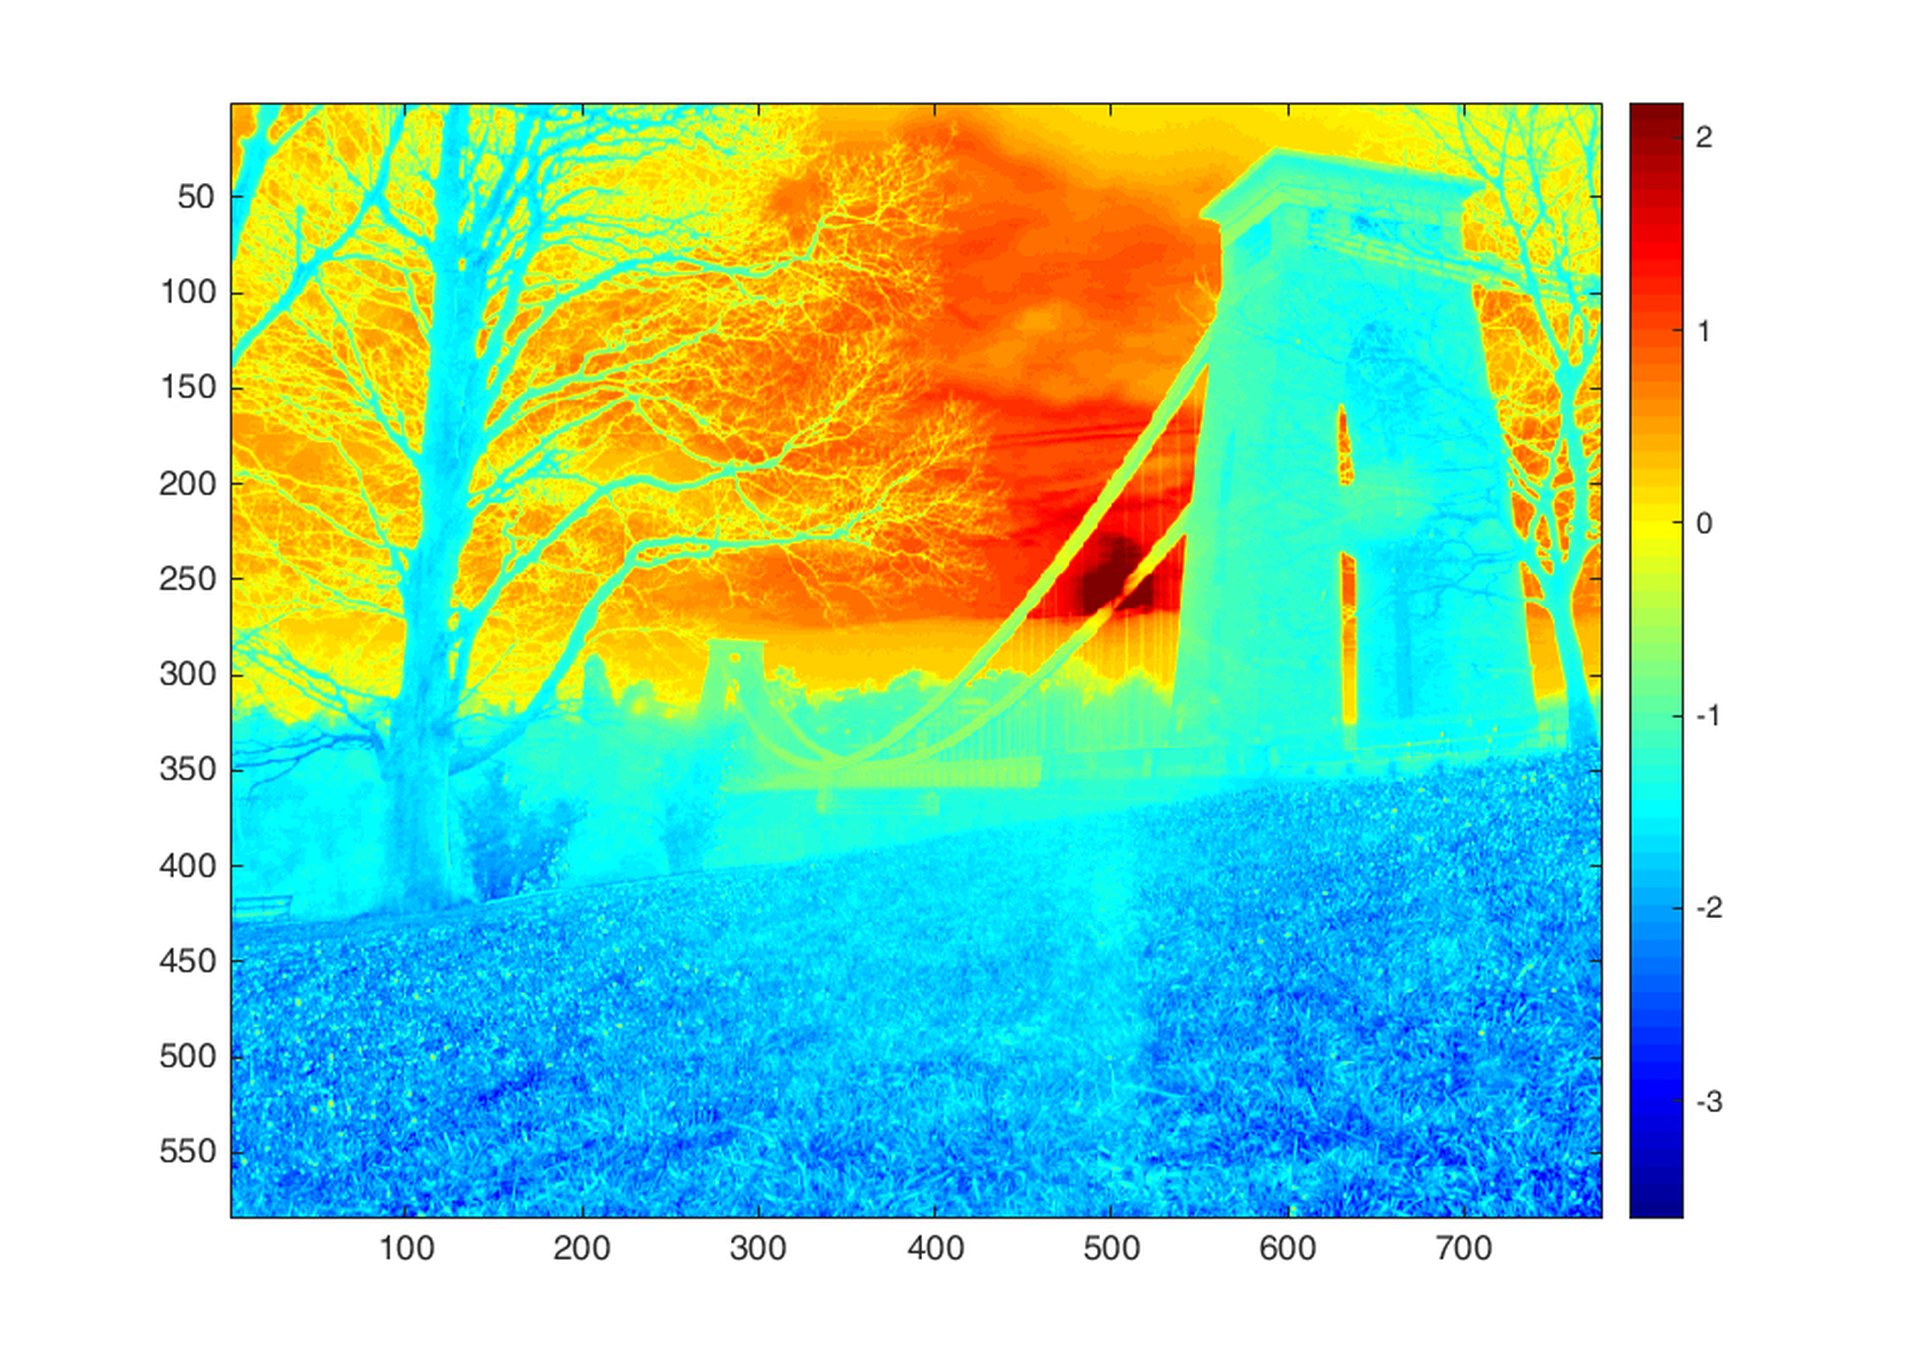
to better understand the statistical distribution of the intensity in each channel, we plot a histogram of all pixels in each channel. The horizontal axis shows the intensity in logarithmic decades (base 10) and vertical axis shows the pixel count at the given intensity:
A=reshape(hdrL_r,[],1);
B=reshape(hdrL_g,[],1);
C=reshape(hdrL_b,[],1);

figure;
[h, bins] = hist(A,200);
plot(bins,h,'-r');
hold on;
[h, bins] = hist(B,200);
plot(bins,h,'-g');
[h, bins] = hist(C,200);
plot(bins,h,'-b');
hold off;
The blue and red channels have roughly 4 decades of dynamic range and the blue channel has nearly 5 decades of dynamic range, however, the brightness (i.e. luminance) of each pixel is calculated using the ITU.REC.709 standard definition:
hdr_y=0.2126*hdr_r + 0.7152*hdr_g + 0.0722*hdr_b;

D=reshape(log10(hdr_y),[],1);
hist(D,1000);
the luminance of the image shows approximately 4 decades of dynamic range since the blue channel has negligible contribution in the brightness of a pixel. There are two clear distinct peaks in the histogram which are associated with the shadow parts of the image (the grass, tree, etc) and the highlight part of the image (the sky and the sun). There are more pixels in the shadows than the highlights.
In order to apply the tone mapping, we compress the 4 decades of luminance into 2 decades (100:1) which is suitable for an LDR display. This operation compresses the histogram to [-2,0] in the logarithmic domain.
L=-1.8;
H=2.2;

hdrLrgb=(log10(hdr)-H)*(2/(H-L));
We have to return back from logarithmic domain into linear domain:
hdrLrgb_lin=10.^hdrLrgb;

hdrLrgb_lin_y=0.2126*hdrLrgb_lin(:,:,1) + 0.7152*hdrLrgb_lin(:,:,2) + 0.0722*hdrLrgb_lin(:,:,3);
D=reshape(log10(hdrLrgb_lin_y),[],1);
hist(D,1000);
the final tone mapped image looks like:
imshow(lin2rgb(hdrLrgb_lin));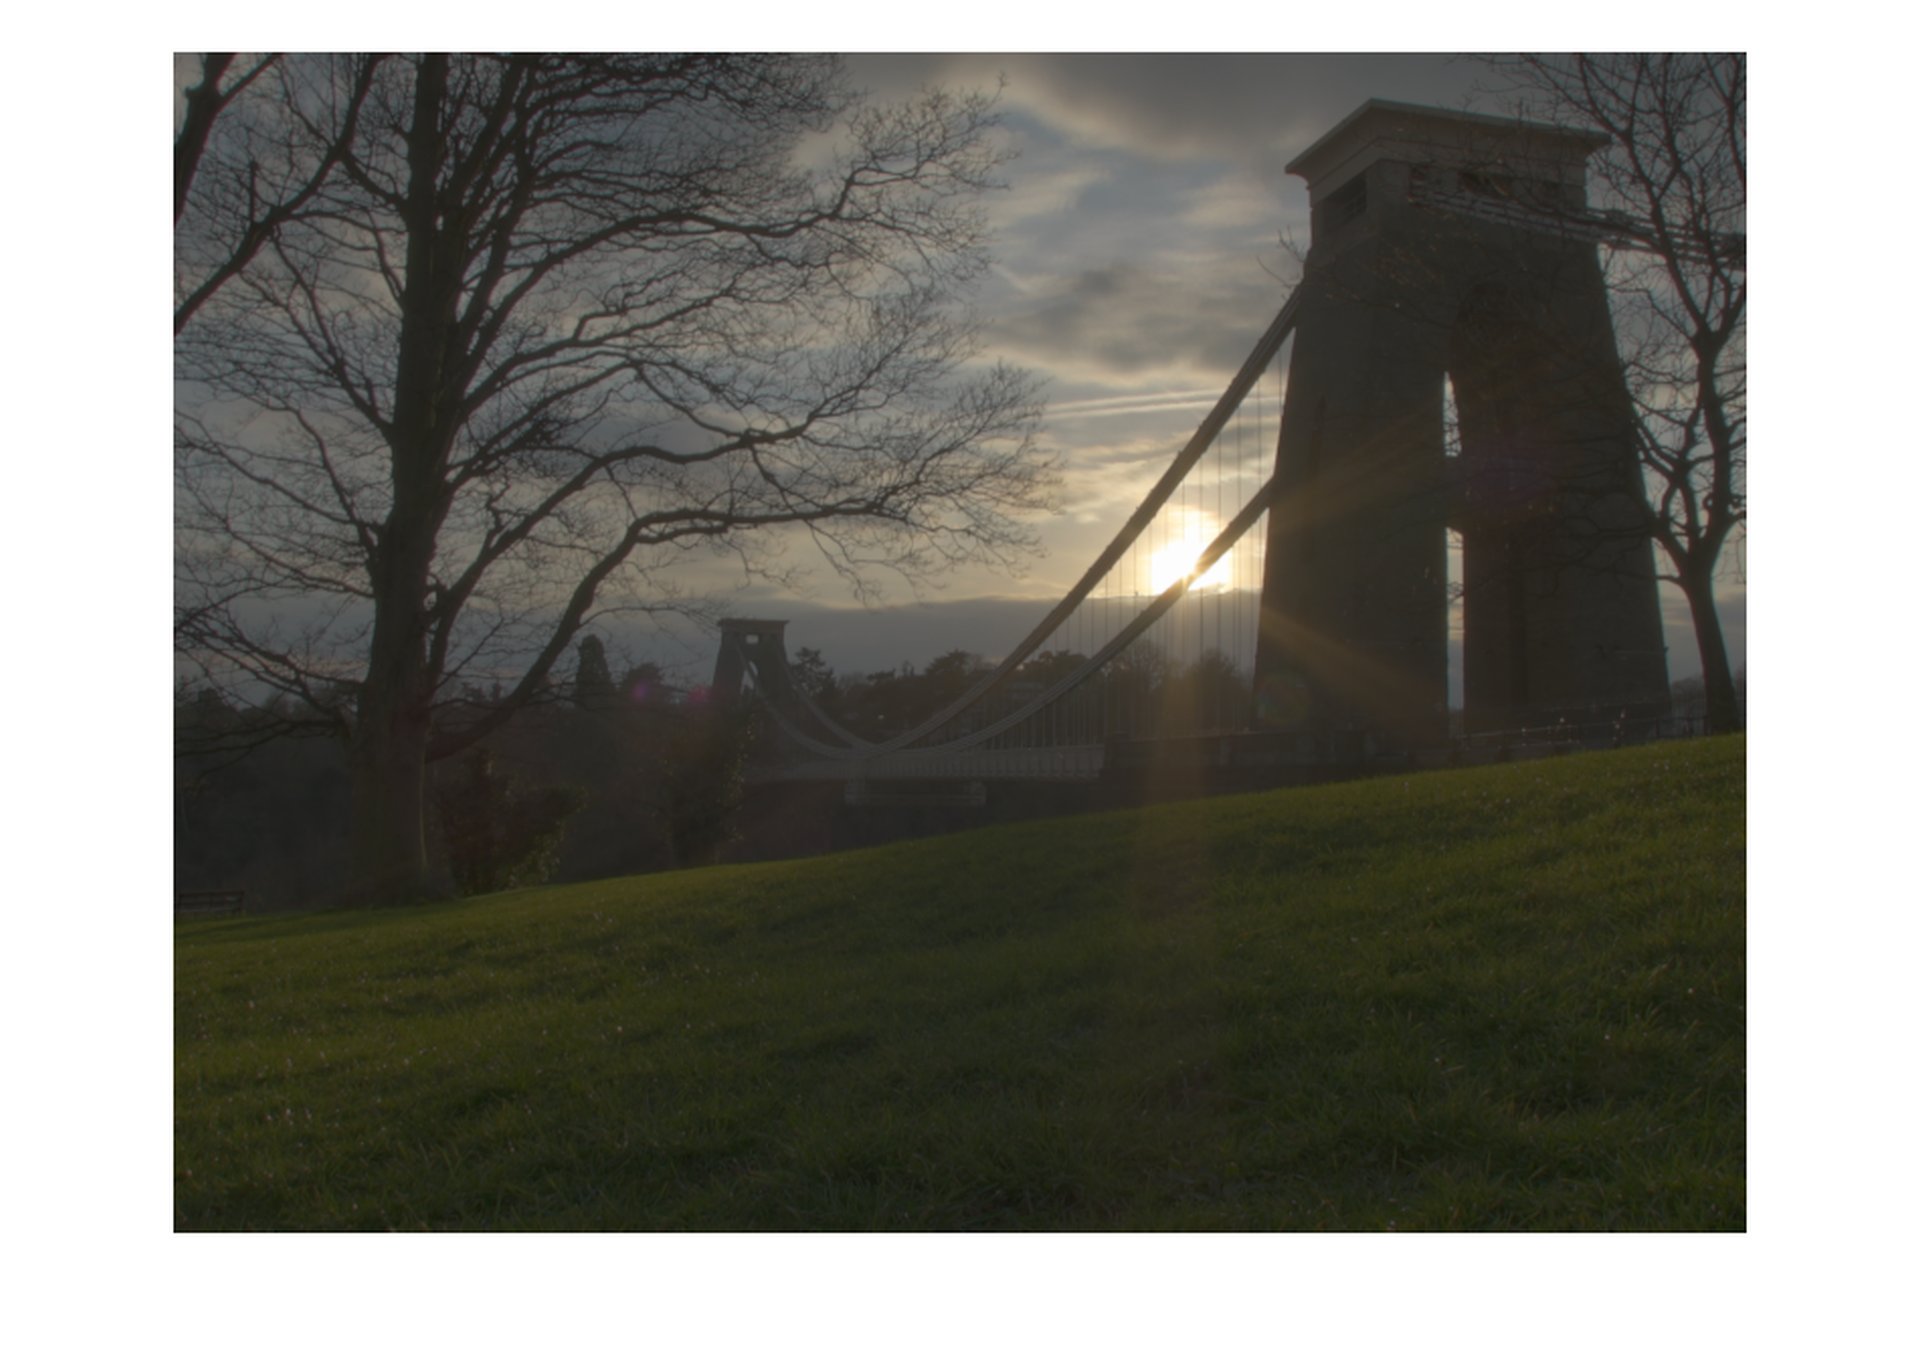
However, this image still has a high contrast due to two distinct distribution of shadows and highlights in its histogram. We have to somehow, bring these two peaks closer the centre of the histogram, and flatten the contrast profile. In order to achieve this, we apply local Laplace filter to add micro contrast while decreasing the overall contrast, pulling all the peaks of histogram into the centre of the dynamic range:
local1 = locallapfilt(hdrLrgb,0.4,0.3,'ColorMode', 'separate');recalculating the brightness:
local1x=10.^local1;
local1_y=0.2126*local1x(:,:,1) + 0.7152*local1x(:,:,2) + 0.0722*local1x(:,:,3);
D=reshape(log10(local1_y),[],1);
hist(D,1000);
the final tone mapped image looks like:
imshow(lin2rgb(hdrLrgb_lin));
However, this image still has a high contrast due to two distinct distribution of shadows and highlights in its histogram. We have to somehow, bring these two peaks closer the centre of the histogram, and flatten the contrast profile. In order to achieve this, we apply local Laplace filter to add micro contrast while decreasing the overall contrast, pulling all the peaks of histogram into the centre of the dynamic range:
local1 = locallapfilt(hdrLrgb,0.4,0.3,'ColorMode', 'separate');recalculating the brightness:
local1x=10.^local1;
local1_y=0.2126*local1x(:,:,1) + 0.7152*local1x(:,:,2) + 0.0722*local1x(:,:,3);
D=reshape(log10(local1_y),[],1);
hist(D,1000);
compressing the dynamic range to 100:1, and converting back into linear colour space:
local2=(local1-0.4)*(2.0/2.8);

local2x= 10.^local2;
imshow(lin2rgb(local2x));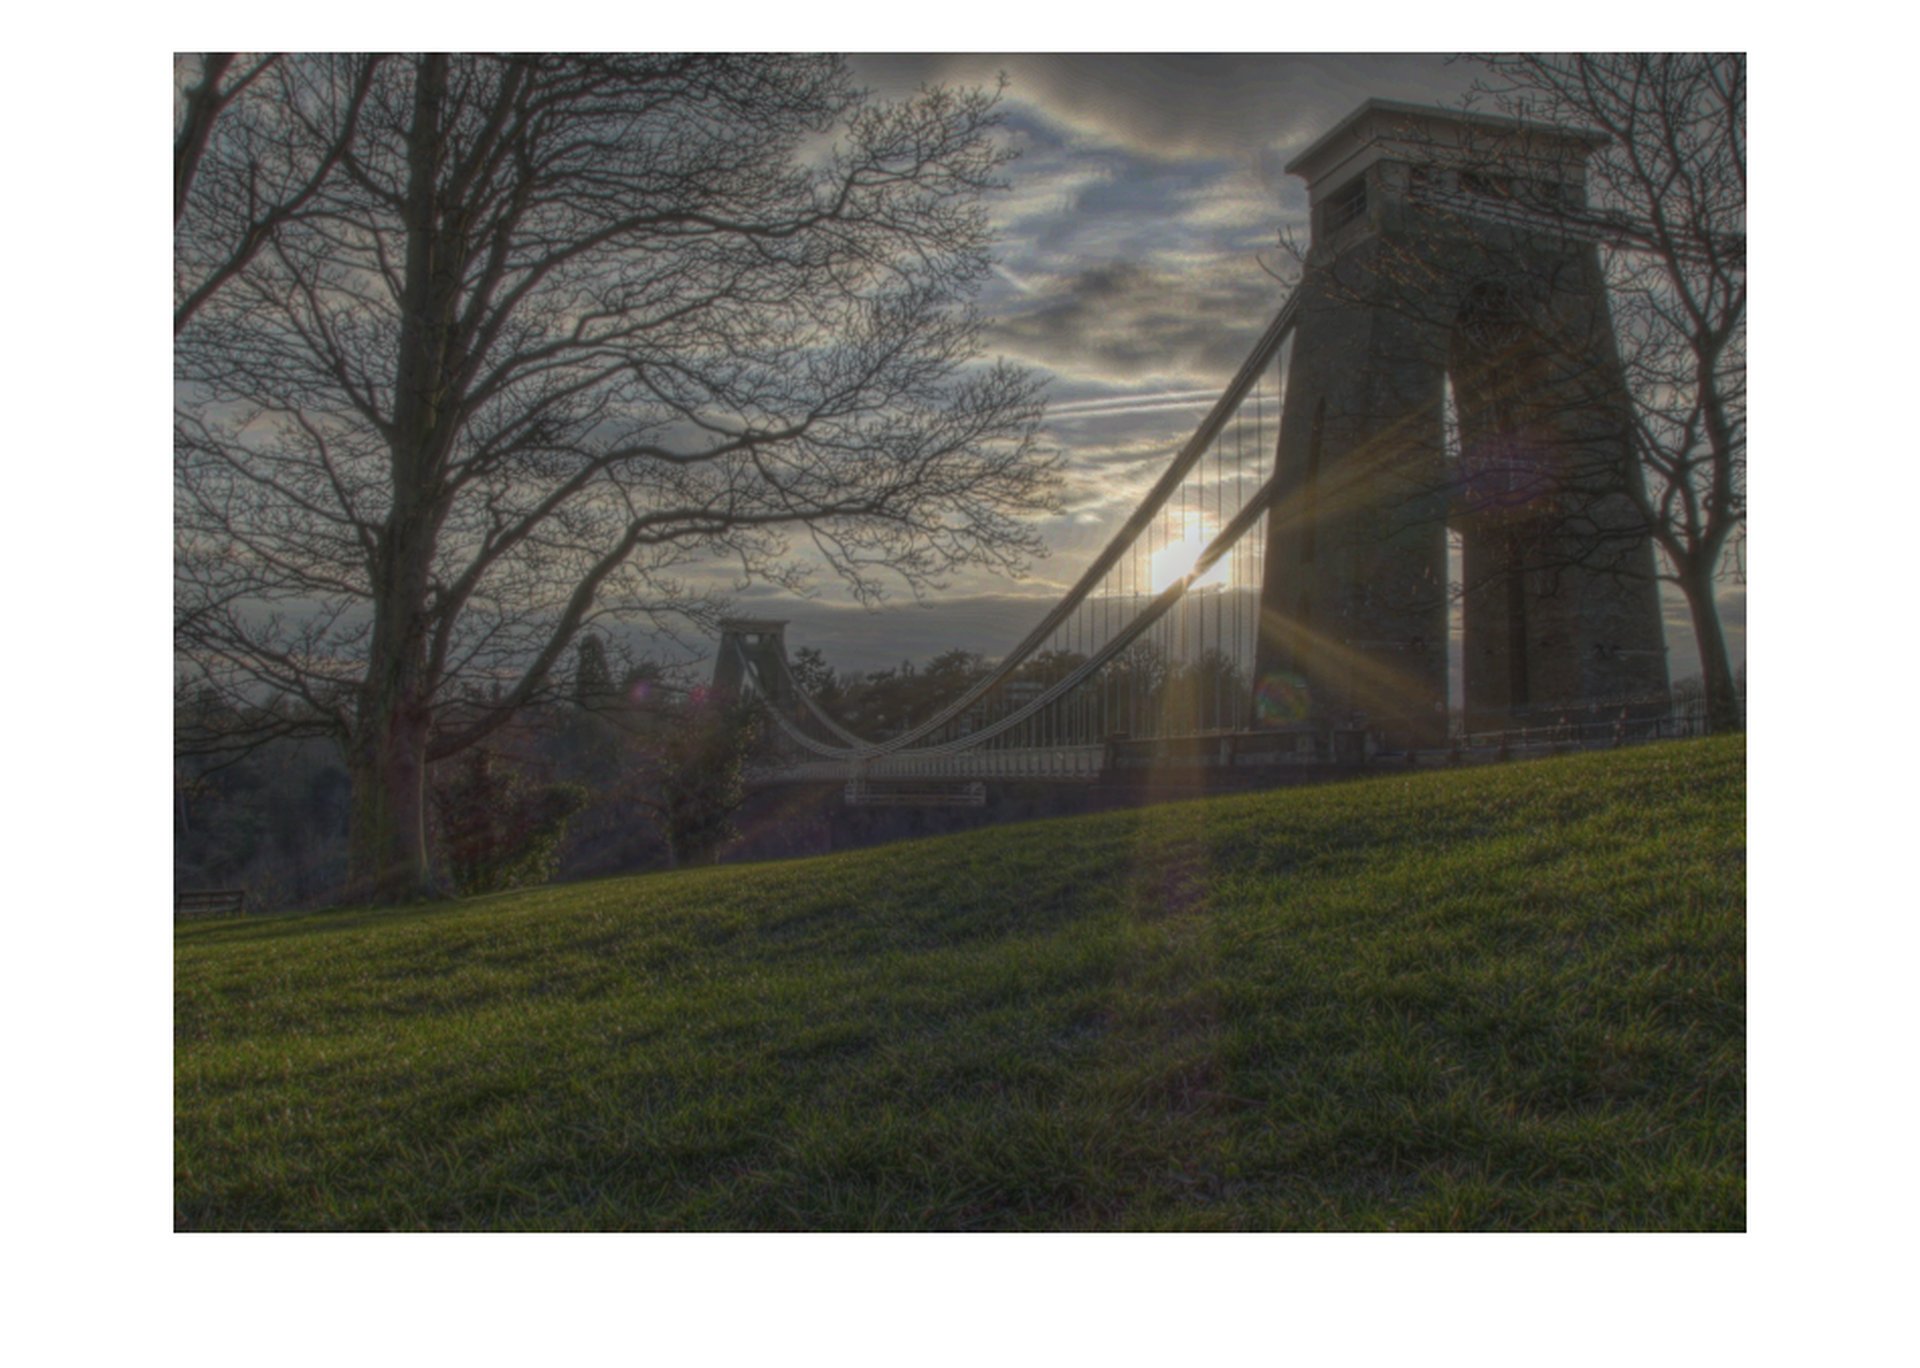
This tone mapped version of image provides more details in shadows and highlights. The movement artefacts are now visible in the sky region. To enhance the colour saturation which is supressed due to logarithmic compression, first we convert the image from linear colour space to HSV colour space:
HSV = rgb2hsv(lin2rgb(local2x));Adding 50% more saturation:
HSV(:, :, 2) = HSV(:, :, 2) * 1.5;As a cautionary procedure we limit the saturation values to unity:
HSV(HSV > 1) = 1;
imshow( hsv2rgb(HSV));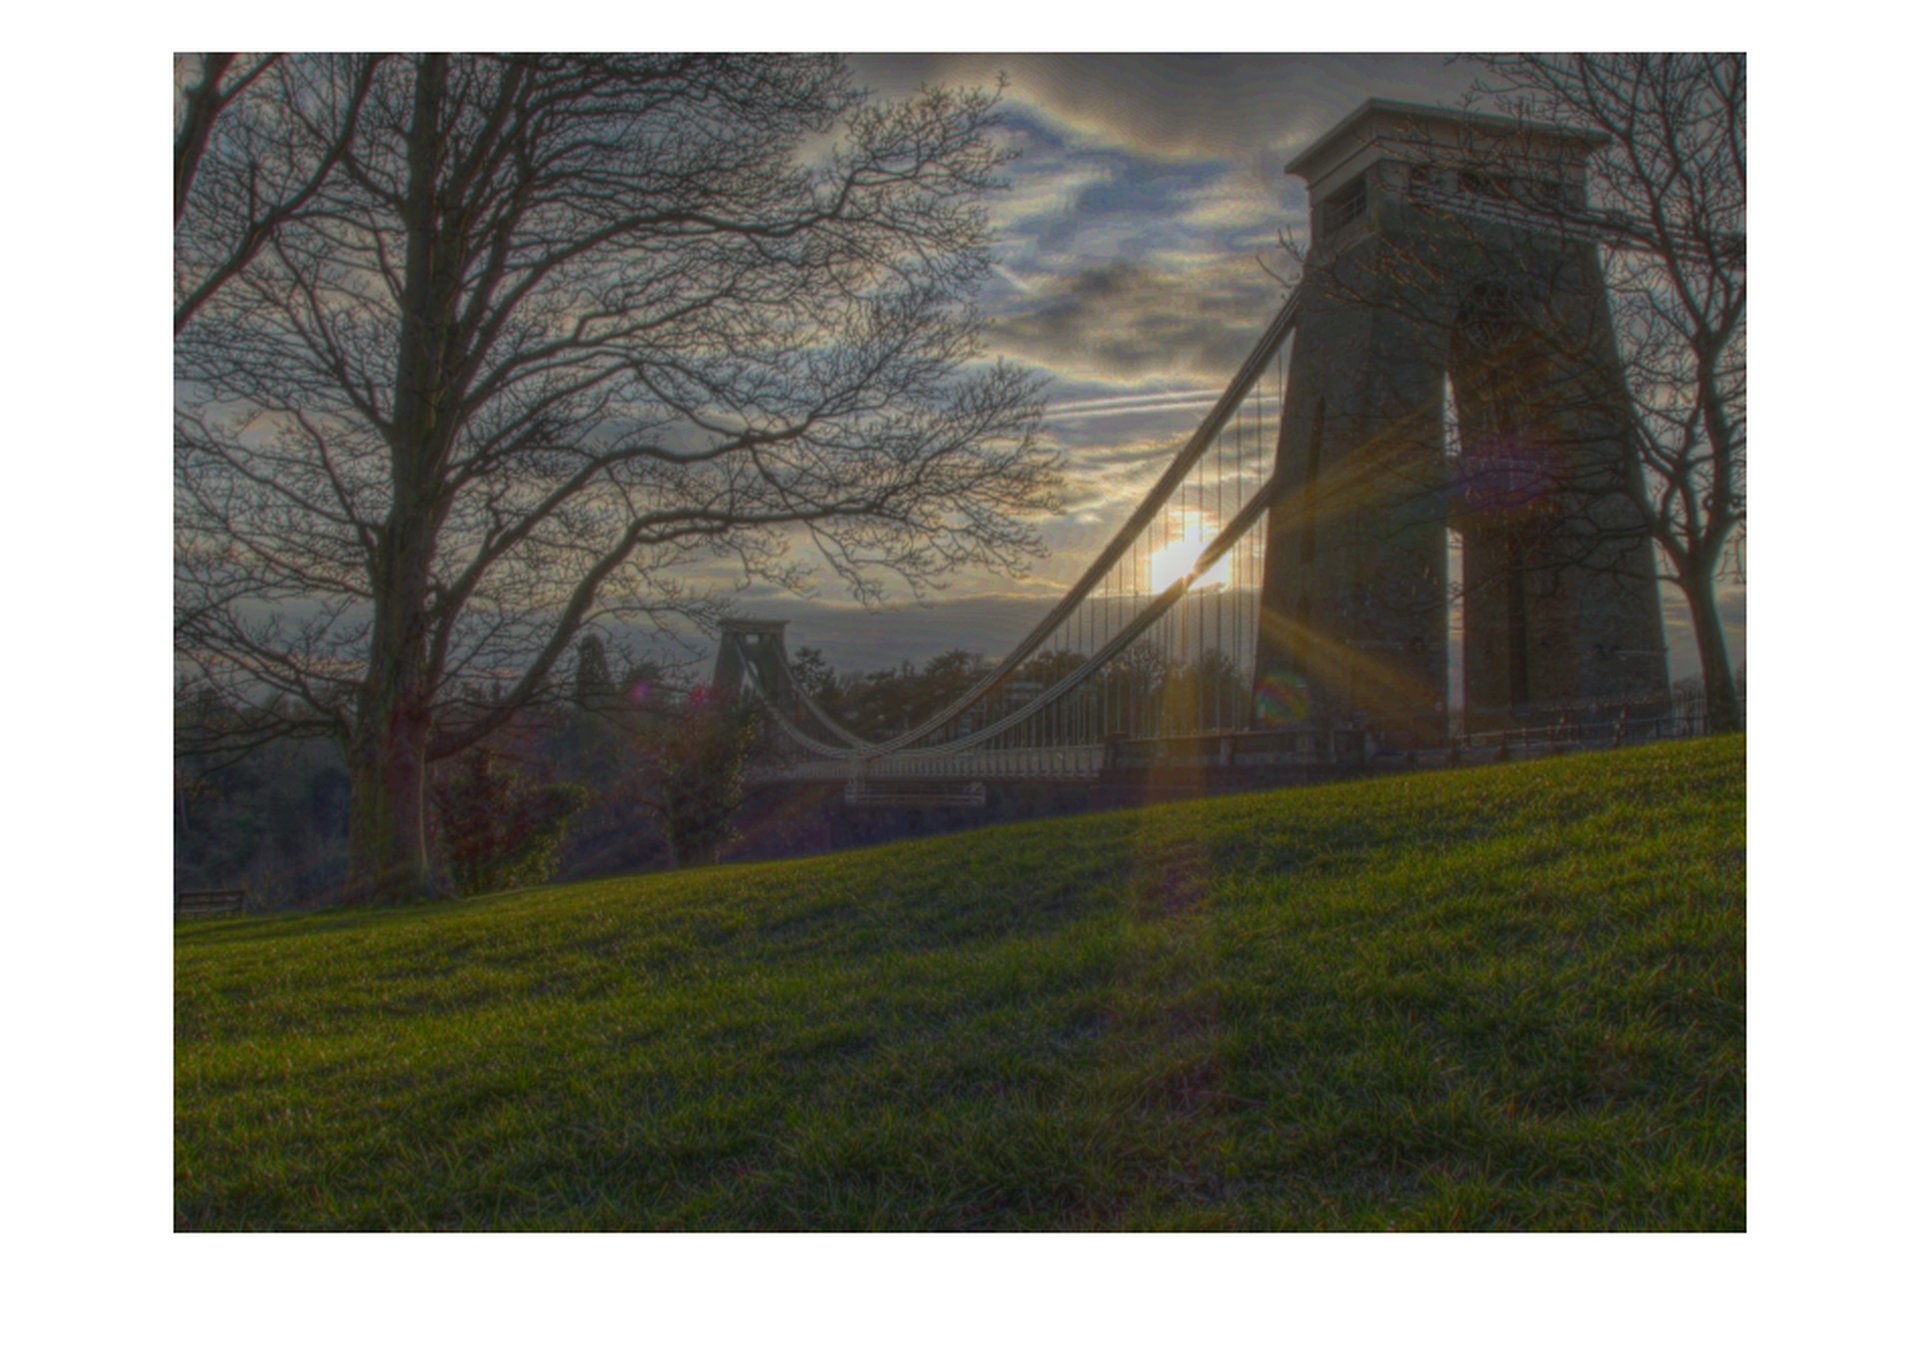
Now some of the green and yellow tint of the sunset is resorted.
Below shows the comparison of three different methods of tone-mapping. The first, is the a simple histogram compression in logarithmic mode, the second is logarithmic compression with enhanced local contrast using Laplace filter, and third is the default setting for Adobe Photoshop HDR tone mapping local adaption.


